

Dear Editor,
Diabetes mellitus (DM) and chronic kidney disease (CKD) are prevalent, costly, and frequently co-occur in older adults, yet their independent and joint contributions to hospital spending in Asian public-sector settings remain poorly defined. Compared with those having neither condition, expenditures are about 3 to 4 times higher in CKD and 2.3 times higher in DM.1,2 Prior Singapore studies examined CKD progression costs within type 2 DM but did not isolate the independent cost of CKD without DM, nor decompose spending into service components.3 The authors therefore examined the independent and joint associations of DM and CKD with annual hospital costs and the service components driving excess spending.
This is a retrospective cohort study using 1-year data (June 2024 to May 2025) from the 326-bed Alexandra Hospital, a public general hospital in Singapore. Eligible patients were Singapore citizens aged 60 years or older with at least 1 encounter, yielding 4699 patients. Gross annual hospital costs in Singapore dollars (SGD) were disaggregated into 5 components: inpatient care, outpatient care, diagnostics, procedures and therapeutics, and medications/consumables/other. Patients were classified according to International Classification of Diseases 10th Revision (ICD-10) by active diagnoses (DM E10-E14; CKD N18, N19) as “neither” (n=3016), “DM-only” (n=1008), “CKD-only” (n=315), or “both” (n=360). A generalised linear model with gamma distribution and log link was used to examine total costs, given the right-skewed distribution of hospital costs, and adjusted for sex, age group, ethnicity, Community Health Assist Scheme tier (i.e. public subsidies extended to Singapore citizens based on household income), and count of other chronic conditions (identified using a validated administrative algorithm).4 Diagnosis coding was performed by trained medical record officers in the hospital’s medical records office, following standard institutional coding practice. Covariates were selected a priori based on established socio-demographic and clinical confounders reported in the DM-CKD cost literature. Ordinary least squares regression was used for decomposition. Because the model uses a log link, each coefficient (β) reflects the proportional, rather than absolute, change in cost; exponentiating the coefficient and subtracting 1 gives the percentage difference in cost relative to the reference group. Significance was pre-specified at P<0.10, given the small “CKD-only” subgroup and high cost variability.5 Ethical approval was obtained with a waiver of patient consent.
The mean age was 75.3 ± 8.81 years; 56.1% were female and 79.3% Chinese. Total annual costs were highly skewed (median SGD430.46, mean SGD1599.41); 39.8% of patients incurred no inpatient costs at all, so the entirety of inpatient expenditure was borne by the remaining 60% of patients. Consistent with the well-recognised concentration of hospital spending, a relatively small subset within this 60% is likely to account for a disproportionate share of that expenditure. After adjustment, “CKD-only” patients had 45.1% higher total costs than the “neither” group (β=0.372, P=0.034), whereas “DM-only” patients showed no significant difference (β=−0.005, P=0.971) and the “both” group a non-significant 18.6% increase (β=0.171, P=0.414). Patients aged 80 years and above (β=0.576, P<0.001) and each additional chronic condition (β=0.122, P=0.046) incurred higher costs. Compared with Chinese patients, costs were 42.2% higher in Malay patients (P=0.073), 65.9% higher in Indian patients (P=0.008), and 122.1% higher in other ethnic groups (P=0.001). A sensitivity model with a DM × CKD interaction term yielded an identical CKD coefficient (β=0.372) and a non-significant interaction (β=−0.196, P=0.486), supporting CKD as the principal independent cost driver.
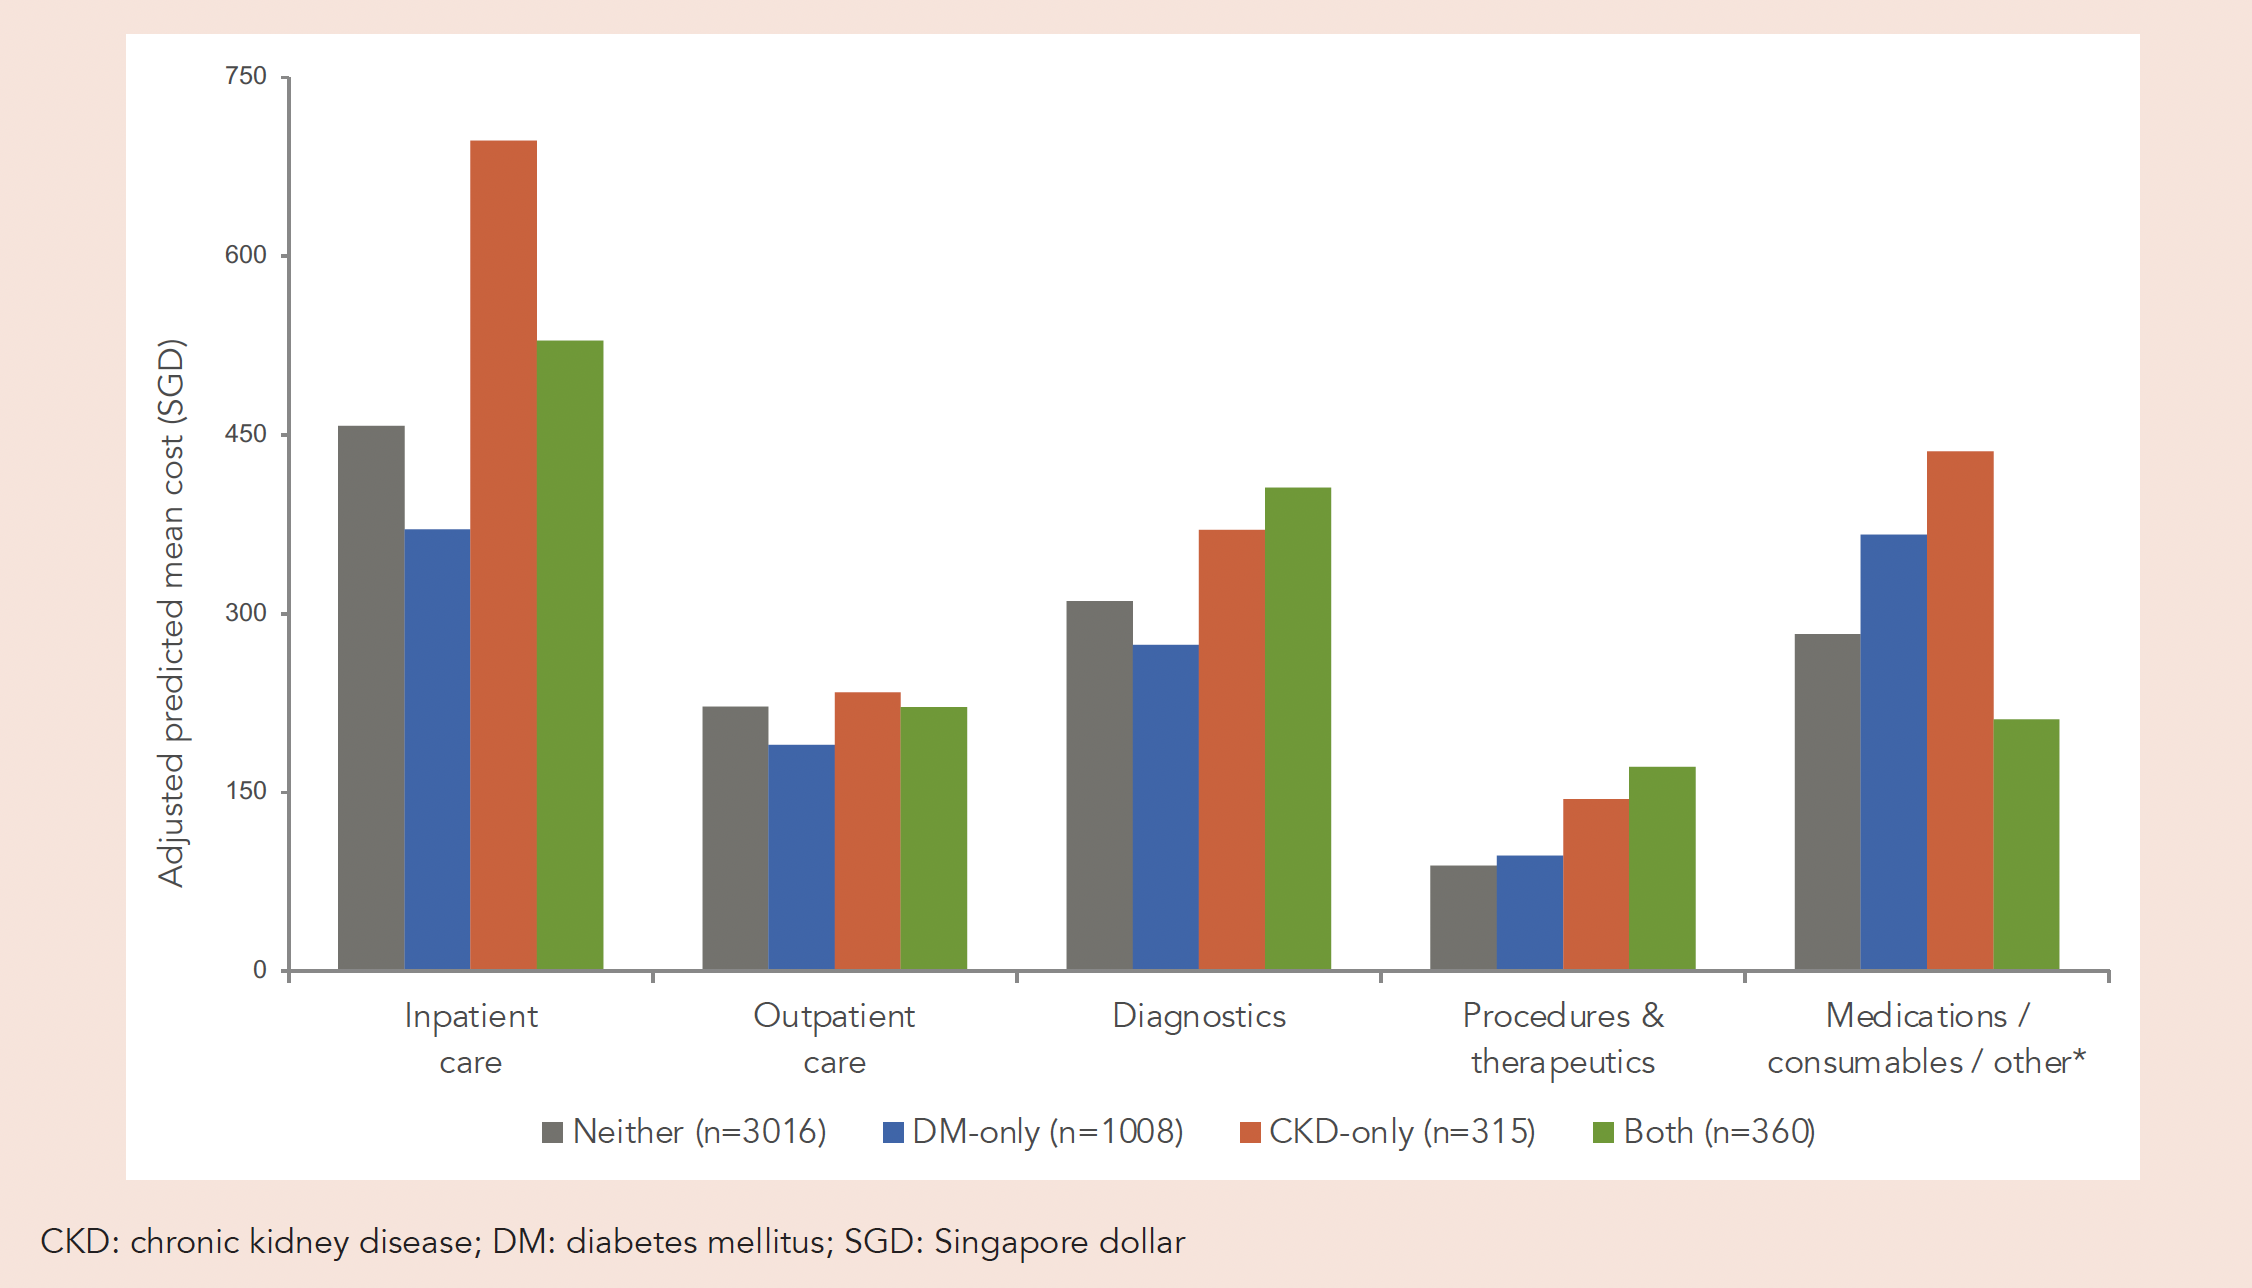
Decomposition of the SGD520.58 total excess cost for “CKD-only” patients relative to the “neither” group (90% confidence interval [CI] −56.22 to 1097.39; P=0.138) showed that it was driven mainly by 2 components. Inpatient care contributed the largest share (SGD239.72; 46.0%; P=0.184), followed by medications/consumables/other (SGD153.60; 29.5%), the only component reaching significance in this model (P=0.093); together they accounted for roughly three-quarters of the excess. The remaining 3 components contributed less than a quarter combined: diagnostics (SGD59.45; 11.4%), procedures and therapeutics (SGD55.90; 10.7%), and outpatient care (SGD11.92; 2.3%). Predicted mean costs by group and component are shown in Fig. 1. “CKD-only” patients had the highest total cost (SGD1880.99), driven mainly by inpatient care (SGD697.02) and medications (SGD436.18). Notably, patients with both conditions had the lowest adjusted medication cost (SGD211.19), below even the “neither” group (SGD282.59).
Fig. 1. Adjusted predicted mean costs.
The finding that CKD, but not DM, independently drives hospital costs is consistent with the disproportionate economic burden of kidney disease and the observation that costs track declining renal function more than DM alone.6 CKD often remains asymptomatic until complications such as cardiovascular disease, anaemia, and mineral bone disorders demand hospitalisation, specialist care, and complex medication regimens, whereas well-controlled DM is largely managed in primary care. Medications likely reflect the high cost of agents such as erythropoiesis-stimulating agents, phosphate binders, and cardiovascular drugs essential for slowing the progression of CKD.7
The paradoxically low medication cost in the “both” group most plausibly reflects care-shifting. Patients with multiple comorbid conditions frequently obtain much of their medication through community pharmacies, dialysis centres, or national programmes outside of hospital billing, so the hospital record captures only a fraction of their true use. Survivor bias may also contribute, as those with the most advanced disease may not survive a full costing year. That the most complex patients appear least expensive within 1 institution is precisely why hospital costs alone understate their true burden.
Ethnic cost disparities persisted after adjustment for DM-CKD status, age, and comorbidity burden, indicating that these differences are not attributable to differential prevalence of DM or CKD across ethnic groups. Rather, they likely reflect a higher underlying severity of disease within each comorbidity category and delayed presentation,8 together with differential use of private care outside the public system, given income-related differences in access previously reported locally.9
Two intervention targets follow directly from the cost structure. First, structured medication review and adherence support may improve the appropriateness of prescribing and help prevent CKD-related complications and avoidable hospitalisations, given the close interrelationship of multimorbidity, polypharmacy, and frailty in older patients; expanded subsidies for evidence-based CKD therapies would primarily ease patient out-of-pocket burden rather than necessarily reduce total system-level medication expenditure. Second, the large inpatient contribution reinforces the case for hospitalisation prevention through multidisciplinary, community-based CKD care, as delivered locally in primary care.10 Patients aged 80 years and above—the costliest subgroup—warrant age-specific care models.
Limitations include reliance on a single hospital with a care model and patient demographic that may not be generalisable to other institutions; absence of CKD stage and glycaemic control; reliance on ICD-10 diagnosis coding (N18/N19) without dedicated capture of dialysis or transplant status, which may have led to some misclassification; and the observational design, which precludes causal inference and makes residual confounding likely despite adjustment for measured covariates. As patients with milder disease are more likely to be managed in community settings, the hospital-based cohort may not represent the full spectrum of DM-CKD comorbidity, and the inability to capture costs incurred outside this hospital likely understates the true economic burden across all groups, particularly in the “both” group. Furthermore, as this study examined cost alone, without corresponding data on clinical outcomes, quality of life, or cost-effectiveness, higher costs in CKD patients should not be interpreted as inherently undesirable; they may in part reflect necessary and appropriate intensification of care. Consequently, the mechanisms underlying elevated inpatient costs, such as length of stay, admission acuity, dialysis modality, and procedure intensity, could not be examined and represent an important direction for future study using more granular clinical data, such as linkage to renal registries.
In conclusion, CKD independently drives higher hospital costs in older Singapore patients, with inpatient care and medications as the key contributors and clear targets for medication optimisation and hospitalisation prevention. Lower hospital medication costs in comorbid patients highlight the need for linked data systems to capture the true cost of care across settings, while ethnic disparities support culturally tailored chronic disease programmes and community outreach.
Acknowledgements
The authors would like to thank Parthiban Kuppusamy and Wendy Loh from the Academic Informatics Office, and Venette Foo from the Finance Department, both of Alexandra Hospital, for assisting them with the data extraction.
REFERENCES
- Golestaneh L, Alvarez PJ, Reaven NL, et al. All-cause costs increase exponentially with increased chronic kidney disease stage. Am J Manag Care 2017;23:S163-72.
- Yang W, Dall TM, Beronjia K, et al. Economic costs of diabetes in the U.S. in 2017. Diabetes Care 2018;41:917-28.
- Low S, Lim SC, Zhang X, et al. Medical costs associated with chronic kidney disease progression in an Asian population with type 2 diabetes mellitus. Nephrology (Carlton) 2019;24:534-41.
- Tonelli M, Wiebe N, Fortin M, et al. Methods for identifying 30 chronic conditions: Application to administrative data. BMC Med Inform Decis Mak 2015;15:31.
- Horgan G. P value variability and subgroup testing. Eur J Nutr 2021;60:4203-6.
- Nichols GA, Ustyugova A, Déruaz-Luyet A, et al. Health care costs by type of expenditure across eGFR stages among patients with and without diabetes, cardiovascular disease, and heart failure. J Am Soc Nephrol 2020;31:1594-601.
- Balducci F, Di Rosa M, Roller-Wirnsberger R, et al. Healthcare costs in relation to kidney function among older people: the SCOPE study. Eur Geriatr Med 2025;16:135-48.
- Chua YT, Leo CH, Chua HR, et al. Disparities in ethnicity and metabolic disease burden in referrals to nephrology. Singapore Med J 2025;66:301-6.
- Singapore Department of Statistics. 2016 [Internet]. Resident Households by Monthly Household Income from Work Per Household Member, Ethnic Group and Sex of Head of Household (General Household Survey 2015). https://data.gov.sg/datasets/d_e77cbb26d5372f03065b9c08fe8db81f/view. Accessed 23 March 2026.
- Koh SWC, Ang PY, Wong HC, et al. Five-year outcomes of a holistic programme for managing early chronic kidney disease in primary care. Ann Acad Med Singap 2024;53:597-607.
This is a retrospective analysis of de-identified administrative data. Patient consent was waived by Alexandra Hospital Institutional Review Board (AH-RNR-2025-0002).
No funding was received for this study. The authors declare they have no affiliations or financial involvement with any commercial organisation with a direct financial interest in the subject or materials discussed in the manuscript.
Dr Hui Foh Foong, Medical Affairs – Research, Innovation & Enterprise, Alexandra Hospital, 378 Alexandra Road Singapore 159964. Email: [email protected]
