

ABSTRACT
Introduction: Interpretation and analysis of magnetic resonance imaging (MRI) scans in clinical settings comprise time-consuming visual ratings and complex neuroimage processing that require trained professionals. To combat these challenges, artificial intelligence (AI) techniques can aid clinicians in interpreting brain MRI for accurate diagnosis of neurodegenerative diseases but they require extensive validation. Thus, the aim of this study was to validate the use of AI-based AQUA (Neurophet Inc., Seoul, Republic of Korea) segmentation software in a Southeast Asian community-based cohort with normal cognition, mild cognitive impairment (MCI) and dementia.
Method: Study participants belonged to the community-based Biomarker and Cognition Study in Singapore. Participants aged between 30 and 95 years, having cognitive concerns, with no diagnosis of major psychiatric, neurological or systemic disorders who were recruited consecutively between April 2022 and July 2023 were included. Participants underwent neuropsychological assessments and structural MRI, and were classified as cognitively normal, with MCI or with dementia. MRI pre-processing using automated pipelines, along with human-based visual ratings, were compared against AI-based automated AQUA output. Default mode network grey matter (GM) volumes were compared between cognitively normal, MCI and dementia groups.
Results: A total of 90 participants (mean age at visit was 63.32±10.96 years) were included in the study (30 cognitively normal, 40 MCI and 20 dementia). Non-parametric Spearman correlation analysis indicated that AQUA-based and human-based visual ratings were correlated with total (ρ=0.66; P<0.0001), periventricular (ρ=0.50; P<0.0001) and deep (ρ=0.57; P<0.0001) white matter hyperintensities (WMH). Additionally, volumetric WMH obtained from AQUA and automated pipelines was also strongly correlated (ρ=0.84; P<0.0001) and these correlations remained after controlling for age at visit, sex and diagnosis. Linear regression analyses illustrated significantly different AQUA-derived default mode network GM volumes between cognitively normal, MCI and dementia groups. Dementia participants had significant atrophy in the posterior cingulate cortex compared to cognitively normal participants (P=0.021; 95% confidence interval [CI] -1.25 to -0.08) and in the hippocampus compared to cognitively normal (P=0.0049; 95% CI -1.05 to -0.16) and MCI participants (P=0.0036; 95% CI -1.02 to -0.17).
Conclusion: Our findings demonstrate high concordance between human-based visual ratings and AQUA-based ratings of WMH. Additionally, the AQUA GM segmentation pipeline showed good differentiation in key regions between cognitively normal, MCI and dementia participants. Based on these findings, the automated AQUA software could aid clinicians in examining MRI scans of patients with cognitive impairment.
CLINICAL IMPACT
What is New
- This study aimed to validate the use of artificial intelligence (AI)-based AQUA segmentation software in a Southeast Asian community-based cohort of cognitively normal, mild cognitive impairment and dementia participants.
- There was a high correlation between human-based and AQUA-based visual ratings.
- There was a high correlation between software-based and AQUA-based disease burden quantification.
- AQUA-derived grey matter volumes distinguished between cognitive syndrome stages.
Clinical Implications
- AI techniques show a high correspondence with existing, established automated pipelines and can aid clinicians in interpreting brain MRI for diagnoses.

Dementia is a heterogeneous disorder that is accompanied by brain alterations, such as grey matter (GM) loss and cerebral small vessel disease burden, including white matter hyperintensities (WMH).1,2 Studies show a high prevalence of cerebral small vessel disease in Singapore and the region.3 Notably, WMH have been correlated with poor cognitive outcomes, and predict incident dementia and death as well as higher risk of progression to dementia.4-7 These structurally complex and diverse changes that occur to the brain are significant indicators that can be observed through neuroimaging techniques like magnetic resonance imaging (MRI). The diagnosis of dementia encompasses a spectrum of individuals ranging from those who are cognitively normal, those with mild cognitive impairment (MCI) and lastly, those diagnosed with dementia. The prevalence of dementia in Asia varies, with estimates ranging from 1% to 15% with higher small vessel disease load being associated with faster cognitive decline.8-10 Importantly, dementia is on the rise in the region with numbers expected to triple by the year 2050.11 In the Singapore context, the most recent estimates indicate a dementia prevalence of 8.8% in older adults aged 60 years and above.12
In clinical settings, the diagnosis of dementia is usually carried out through comprehensive neuropsychological assessments alongside a few basic structural MRI scans. MRI is a key diagnostic tool that helps with the understanding of dementia staging and diagnosis. It allows for a better understanding of the structural condition of the brain, given its ability to provide detailed images that can highlight areas of atrophy, abnormal tissue or vascular changes within the brain.
Current methods of interpretation and analysis of brain MRI scans include visual ratings that require trained professionals to visually examine and rate the scans. Given that this is done manually, it can be time-consuming and subjective as ratings can differ depending on the rater.13-15 Although there are software-based neuroimage processing alternatives available, such as the Computational Anatomy Toolbox (CAT12)16 and the Lesion Segmentation Toolbox (LST),17 these still require some form of expertise in neuroimaging. Given the recent estimates indicating a significant rise in the prevalence of dementia, especially in Asia, recent efforts have established artificial intelligence (AI) techniques to aid clinicians in interpreting brain MRI scans for the accurate diagnosis of neurodegenerative diseases.18-24
Some advantages of AI-based automated brain segmentation pipelines include AI-based software for brain MRI volumetric analysis, which is accurate in detecting subtle structural brain changes. This provides clinicians with valuable information for early diagnosis and monitoring disease progression. AI software such as AQUA24,25 (Neurophet Inc., Seoul, Republic of Korea) can provide quantitative information based on brain MRI segmentation, particularly in degenerative brain disorders, which include MCI and dementia. Prior validation studies using the AQUA pipeline have demonstrated a high association between total intracranial volume and years of education, as well as a good association between regional brain volume and the risk of cognitive decline.26,27 However, no prior validation studies using AQUA have examined the effectiveness of its derived GM segmentation in differentiating between cognitive syndromes along the dementia spectrum.
Conducting volumetric analyses and visual ratings of brain MRI scans allows us to measure changes in brain regions associated with Alzheimer’s disease, such as the hippocampus and entorhinal cortex, which are known to undergo significant atrophy in patients with Alzheimer’s disease dementia, with regional volume reduction linked to cognitive decline. Recently, automated methods of detecting WMH have been increasingly popular due to their ability to provide an objective evaluation of WMH, which includes precise volumes and locations of these WMH.24,25 This automated approach is highly beneficial to clinicians and radiologists, as it aids in efficient and informed decision-making, without the hassle of time-consuming visual inspection. In addition, the objective measurements of WMH from automated tools could improve intra- and inter-rater consistency.28 The AQUA pipeline for WMH quantification has illustrated good performance in prior studies compared to traditional methods.24 However, the use of automated pipelines to provide WMH ratings comparable to visual WMH ratings has not been carried out and will need extensive validation prior to their use in clinical settings. This is especially important to enable timely intervention and management of patient symptoms.
To address these gaps, the main aim of this study was to validate the AI-based AQUA segmentation and WMH quantification software against traditional pipelines in a Southeast Asian community-based cohort of cognitively normal, MCI and dementia participants. Given the past validation studies of the AQUA pipeline, we hypothesised that WMH quantification obtained from AQUA would be similar to that obtained from other automated pipelines. Additionally, we hypothesised that there would be a good correlation between human-based visual reads and AQUA-based WMH ratings. We also hypothesised that GM volumes obtained from AQUA would distinguish between syndromes along the dementia spectrum.
METHOD
Participants
Participants were recruited as part of a community-based research cohort from the Dementia Research Centre (Singapore), Lee Kong Chian School of Medicine, Nanyang Technological University, Singapore. All participants had cross-sectional neuroimaging and neuropsychological assessments carried out as part of their visit. Data from April 2022 to July 2023 were considered for this study. Inclusion criteria comprised the presence of a cognitive concern among individuals from the community aged between 30 and 95 years, inclusive of the specified limits. Key exclusion criteria included illiteracy, diagnosis of major psychotic, psychiatric and neurological disorders, and serious systemic disease. Participants recruited into the Biomarker and Cognition Study, Singapore (also known as BIOCIS) cohort, with a diagnosis of cognitively normal, MCI or dementia were selected based on chronological order. A research diagnosis was assigned to each participant based on existing criteria and guided by their performance on the Montreal Cognitive Assessment (MoCA).29-31 Participants with a MoCA score of 27 to 30, inclusive, were classified as cognitively normal. Next, participants who were diagnosed with MCI had scores of 22 to 26, inclusive, on their MoCA test. Lastly, participants who scored less than 22 on their MoCA test were diagnosed with dementia.
Neuropsychological assessments
Neuropsychological assessments through MoCA32 were administered to the participants and rated by trained raters. The MoCA test is a widely used assessment tool by healthcare professionals to monitor cognitive impairment in adults. The MoCA test is deemed as one of the most sensitive neuropsychological tests available for dementia detection. It measures several domains, including executive function as well as memory.
Neuroimaging acquisition
Brain MRI scans for all participants were conducted using the 3T Siemens Prisma Fit scanner (Siemens Healthineers, Erlangen, Germany). The T1-weighted magnetisation-prepared rapid gradient-echo sequence comprised the following parameters: repetition time of 2000 ms, echo time of 2.26 ms, inversion time of 800 ms, flip angle of 8°, matrix size of 256×256 pixels and voxel size of 1.0×1.0×1.0 mm3. The Fluid Attenuated Inversion Recovery (FLAIR) sequence comprised the following parameters: 192 continuous sagittal slices, repetition time/echo time/inversion time = 7000/394/2100 ms, flip angle of 120°, field of view of 320×320 mm2, matrix of 320×320 pixels, isotropic voxel size of 0.8×0.8×1.0 mm3 and bandwidth of 650 Hz/pixel.
All scanned images were reviewed during acquisition, and participants with severe motion artifacts and overt pathological findings were excluded from analysis.
AQUA-based pre-processing of T1-weighted and T2 FLAIR MRI
In T1-weighted MRI brain segmentation of AQUA, brain image pre-processing tasks included min-max intensity normalisation, and histogram matching-based intensity regularisation. Based on cropped local patch images extracted from the whole image, AI algorithms used a three-dimensional convolutional neural network technique to segment brain MRI scans. The proposed architecture employed a variety of AI techniques that enhanced individual brain regions for memory efficiency and robust performance. For efficient training, we performed pre-training and fine-tuning with auxiliary and radiologists-confirmed labels, respectively. This learning strategy enabled heterogeneous neuroimaging data to be used in training without manual annotations. For T2 FLAIR MRI lesion segmentation of AQUA, we developed a spatial augmentation technique that allowed AI algorithms to encompass various pre-defined thicknesses within an iso-cubic dimension (Supplementary Fig. S1). Secondly, leveraging the spatially augmented information, we developed the AI algorithms, which underwent training with the individual characteristics of image slice thickness.28,33,34
White matter hyperintensity visual ratings
MRI neuroimaging assessments were conducted by visually inspecting T1-weighted and FLAIR images obtained. WMH of periventricular and deep white matter lesions were quantified using the Fazekas scale,35 by trained raters with established experience. Specifically, periventricular WMH and deep subcortical WMH were separately rated on a 0 to 3-point scale for both hemispheres. The scoring criteria were as follows: for periventricular WMH, the absence of any WMH = 0; the presence of caps or pencil-thin lining = 1; a smooth halo along the edges of the lateral ventricle = 2; and irregular hyperintensities extending into deep white matter = 3. For deep subcortical WMH, the absence of any WMH = 0; the presence of non-confluent foci of WMH in the deep subcortical region = 1; beginning confluence of WMH foci = 2; and the presence of large confluent areas = 3. The modified Fazekas scale allowed for quantification of white matter lesions in 4 brain regions, namely right periventricular, left periventricular, right deep subcortical and left deep subcortical, to provide a score range of 0–12.9 All visual ratings were performed by 2 independent raters, and any significant discordance in scores was resolved by consensus.
WMH volume derivation
MRI scans were pre-processed using the CAT12 protocol within the Statistical Parametric Mapping 12 toolbox (Wellcome Trust Centre for Neuroimaging, University College London, London, UK; http://dbm.neuro.uni-jena.de/cat12/) in MATLAB 2022b software (The MathWorks Inc, Natick, MA, US). First, T1-weighted scans were spatially normalised to template space, registered and corrected for image inhomogeneities.36,37 The images were then segmented to estimate GM, white matter and cerebrospinal fluid volumes based on voxel intensities. White matter volume was calculated by summing white matter voxels.
CAT12 then applied a low resolution-specific registration technique to align the tissue probability map and CAT12 atlas to individual scans, followed by fine local tissue corrections.38-40 WMH were defined as GM-like voxels near the ventricles with high white matter probability or isolated GM islands within white matter.
Next, WMH were identified using the LST protocol in the Statistical Parametric Mapping toolbox, generating binary WMH lesion probability maps.17,41 First, T2 FLAIR images were co-registered with T1-weighted scans, and T1-weighted images were segmented into GM, white matter and cerebrospinal fluid.42 These segmentations were combined with FLAIR images to estimate WMH probability. A binary lesion map was then grown along voxels that appeared hyperintense on the T2 FLAIR image. T1-weighted and FLAIR images of 10 randomly chosen participants with mild to severe WMH load were segmented at κ = 0.30, κ = 0.20, and κ = 0.10, to define this threshold. κ = 0.10 was selected as the optimal threshold. Finally, the total lesion volume for each participant was extracted using the LST toolbox.
Statistical analysis
Participant demographics
Chi-square or Fisher’s Exact test (where appropriate) were carried out for categorical variables, and an independent samples t-test was used for continuous variables to determine group differences between cognitively normal, MCI and dementia participants (Table 1).
Correlation analyses
We used non-parametric Spearman correlation to assess the association between AQUA-derived Fazekas ratings and human-derived Fazekas ratings for total, periventricular and deep WMH in separate correlation tests. We also used Spearman rank correlation to assess the correlation between AQUA-derived WMH volumes with LST-derived and CAT12-derived WMH volumes. Non-parametric testing was used since WMH ratings and volumes did not show a normal distribution.
Multiple regression analyses
We carried out additional regression analyses to assess the association between AQUA-derived, LST-derived and CAT12-derived WMH volumes after controlling for age at visit, sex and diagnosis as covariates.
Subsequently, using regression analyses, we examined differences in GM volumes between the cognitively normal, MCI and dementia diagnostic groups in key default mode network GM regions. These regions included the hippocampus, posterior cingulate cortex, precuneus and medial orbitofrontal cortex between the diagnostic groups. These default mode network regions were selected since early atrophy in these regions is specifically associated with dementia.43 For this set of analyses, we first carried out an analysis of variance to examine differences in GM between the 3 diagnostic groups. Subsequently, Tukey’s post hoc analysis was carried out to examine pair-wise differences in GM volumes in all regions. Following this, in regions that showed group differences in GM volume in the analysis of variance, we carried out a multiple regression analysis to examine GM volume differences between diagnostic groups, where age at visit and sex were included as covariates.
RESULTS
A total of 90 participants were included in the study, comprising 30 cognitively normal, 40 MCI and 20 dementia participants. The study cohort had an average age at visit of 63.32±10.96 years. Participant demographics are detailed in Table 1. Dementia participants were significantly older compared to both cognitively normal and MCI participants. There were no differences in sex, total intracranial volume and total GM volume between the groups.
Table 1. Participant demographics: Continuous variables are reported as mean (SD) and the categorical variables are reported as frequency (percentage).
|
Cognitively normal (n=30) |
Mild cognitive impairment (n=40) |
Dementia (n=20) |
P value |
|
|
Age at visit, years, mean (SD) |
57.56 (10.89) |
63.82 (8.82) |
70.95 (10.40) |
<0.001 |
|
Sex, female, no. (%) |
22 (73.3) |
27 (67.5) |
14 (70) |
0.87 |
|
Total intracranial volume in mL, mean (SD) |
1462.57 (119.99) |
1456.48 (146.24) |
1443.19 (117.12) |
0.87 |
|
Total grey matter, volume in mL, mean (SD) |
474.32 (40.00) |
468.52 (42.46) |
447.80 (42.38) |
0.08 |
SD: standard deviation
AQUA-based WMH ratings are closely associated with human-based visual ratings
When assessing the association between human-based and AQUA-derived WMH ratings, the Spearman correlation analysis indicated that there was a high correlation for total (ρ=0.66; P<0.0001), periventricular (ρ=0.50; P<0.0001) and deep (ρ=0.57; P<0.0001) WMH.
High correlation between AQUA-based volumes and standard automated pipeline based white matter hyperintensity volumes
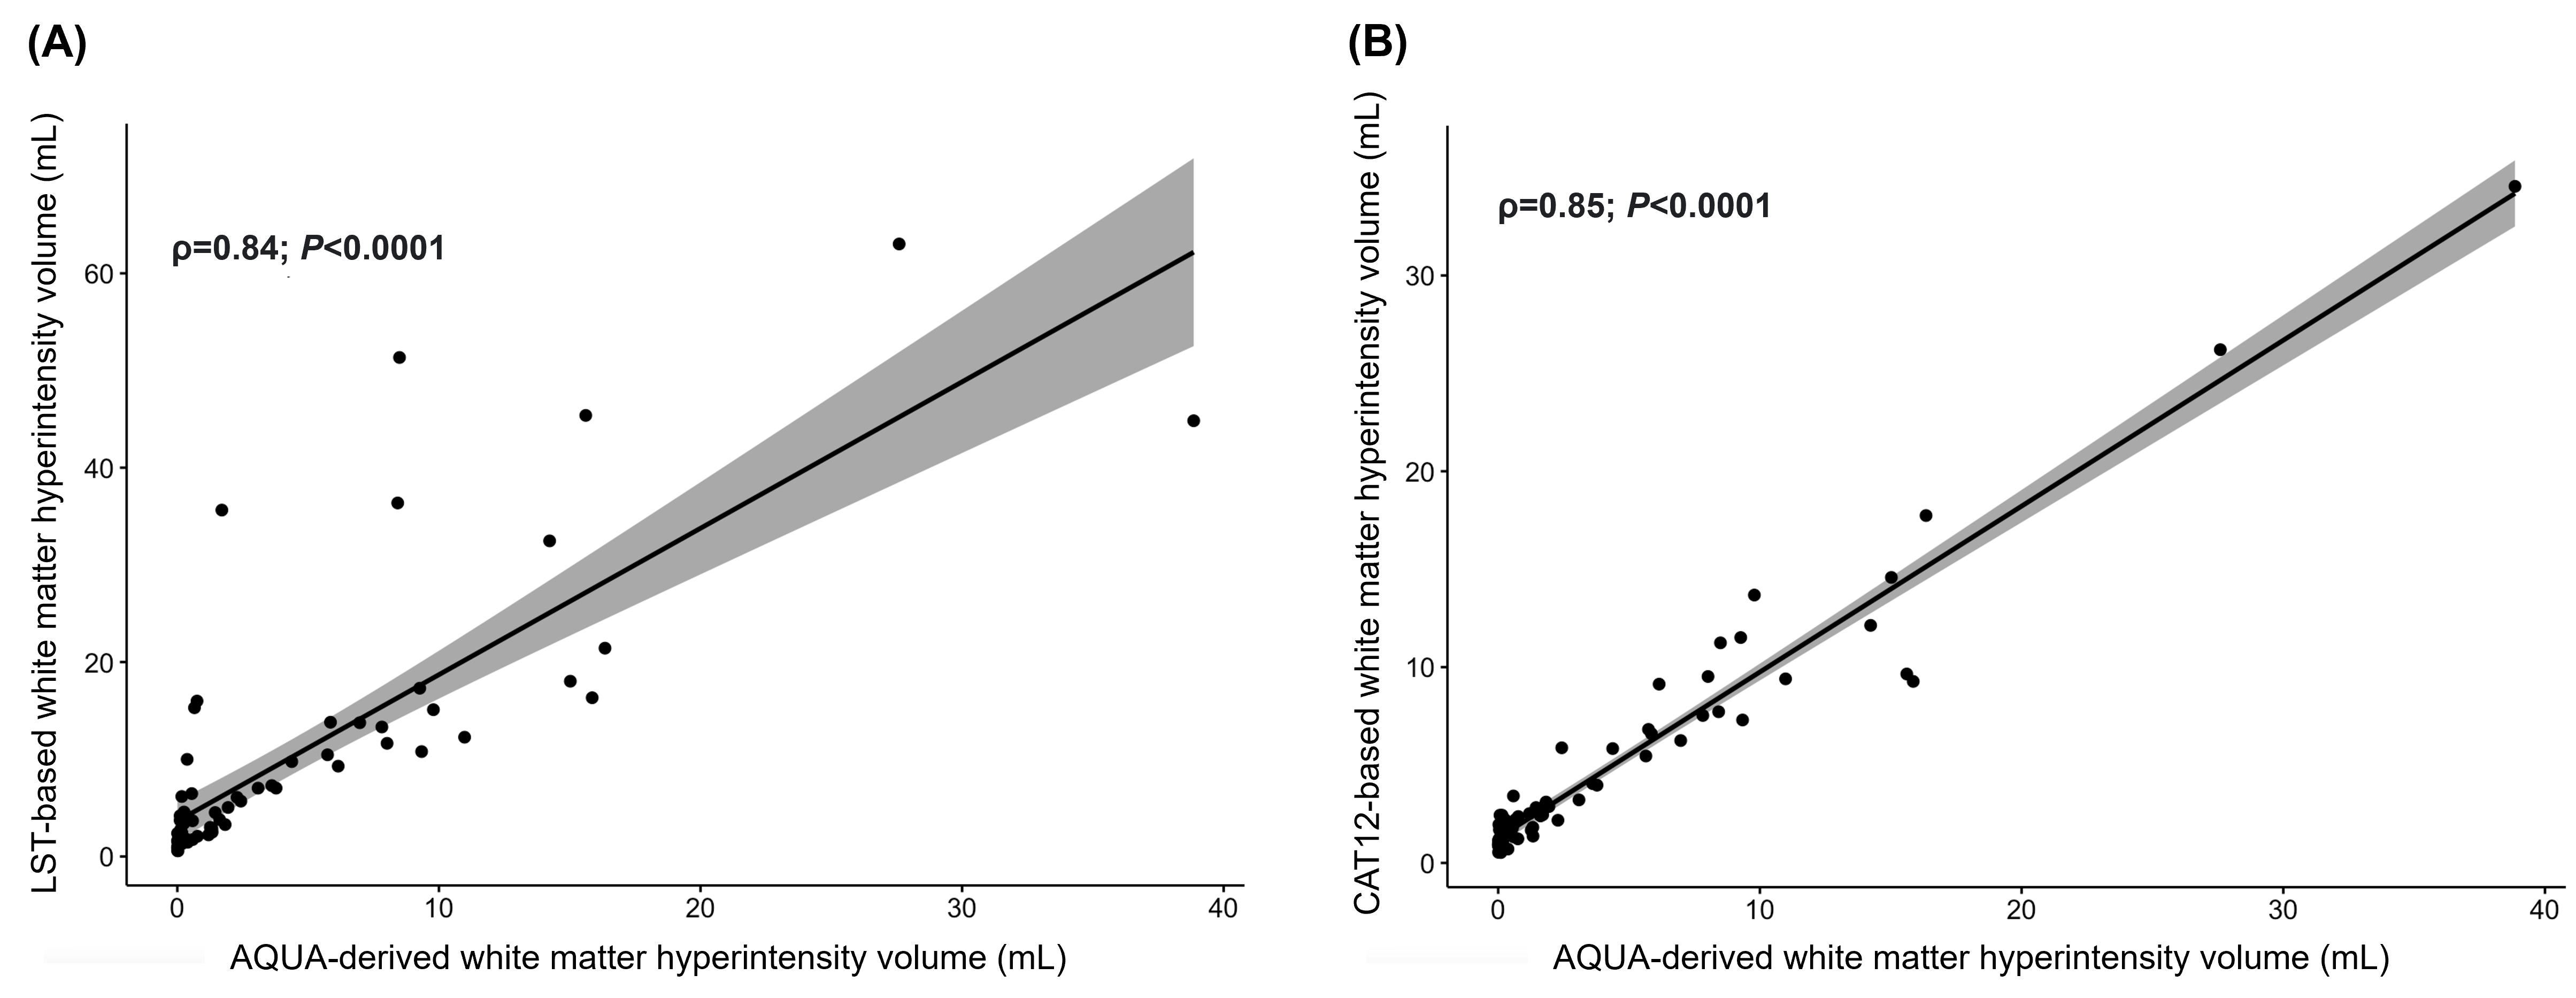
The association between volumetric WMH obtained from AQUA, LST and CAT12 software was assessed using non-parametric Spearman’s rank correlation. Here, AQUA-derived WMH volume was highly correlated with both LST-derived (ρ=0.84; P<0.0001; Fig. 1A) and CAT12-derived (ρ=0.85; P<0.0001; Fig. 1B) WMH volumes.
Fig. 1. High correlation between AQUA-based volumes and standard automated pipeline-based white matter hyperintensity volumes. Spearman rank correlation analyses showed a strong association between AQUA-derived WMH volumes and (A) LST-based as well as (B) CAT12-based WMH volumes. Spearman rank correlation values are indicated as ρ as well as their associated P values. Additional linear regression analyses showed that these associations remained after controlling for age at visit, sex and diagnosis (data in Results section).
 CAT12: Computational Anatomy Toolbox; LST: Lesion Segmentation Toolbox; WMH: white matter hyperintensities
* Indicates significance at the P<0.05 threshold.
Additional linear regression analysis showed a strong association between AQUA-derived WMH and both LST- (β=0.40; P<0.0001; 95% CI 0.31–0.49) and CAT12-derived (β=1.10; P<0.0001; 95% CI 1.02–1.16) WMH volumes after controlling for age at visit, sex and diagnosis.
Group differences in AQUA derived GM volumes in default mode network regions between cognitively normal, mild cognitive impairment and dementia groups
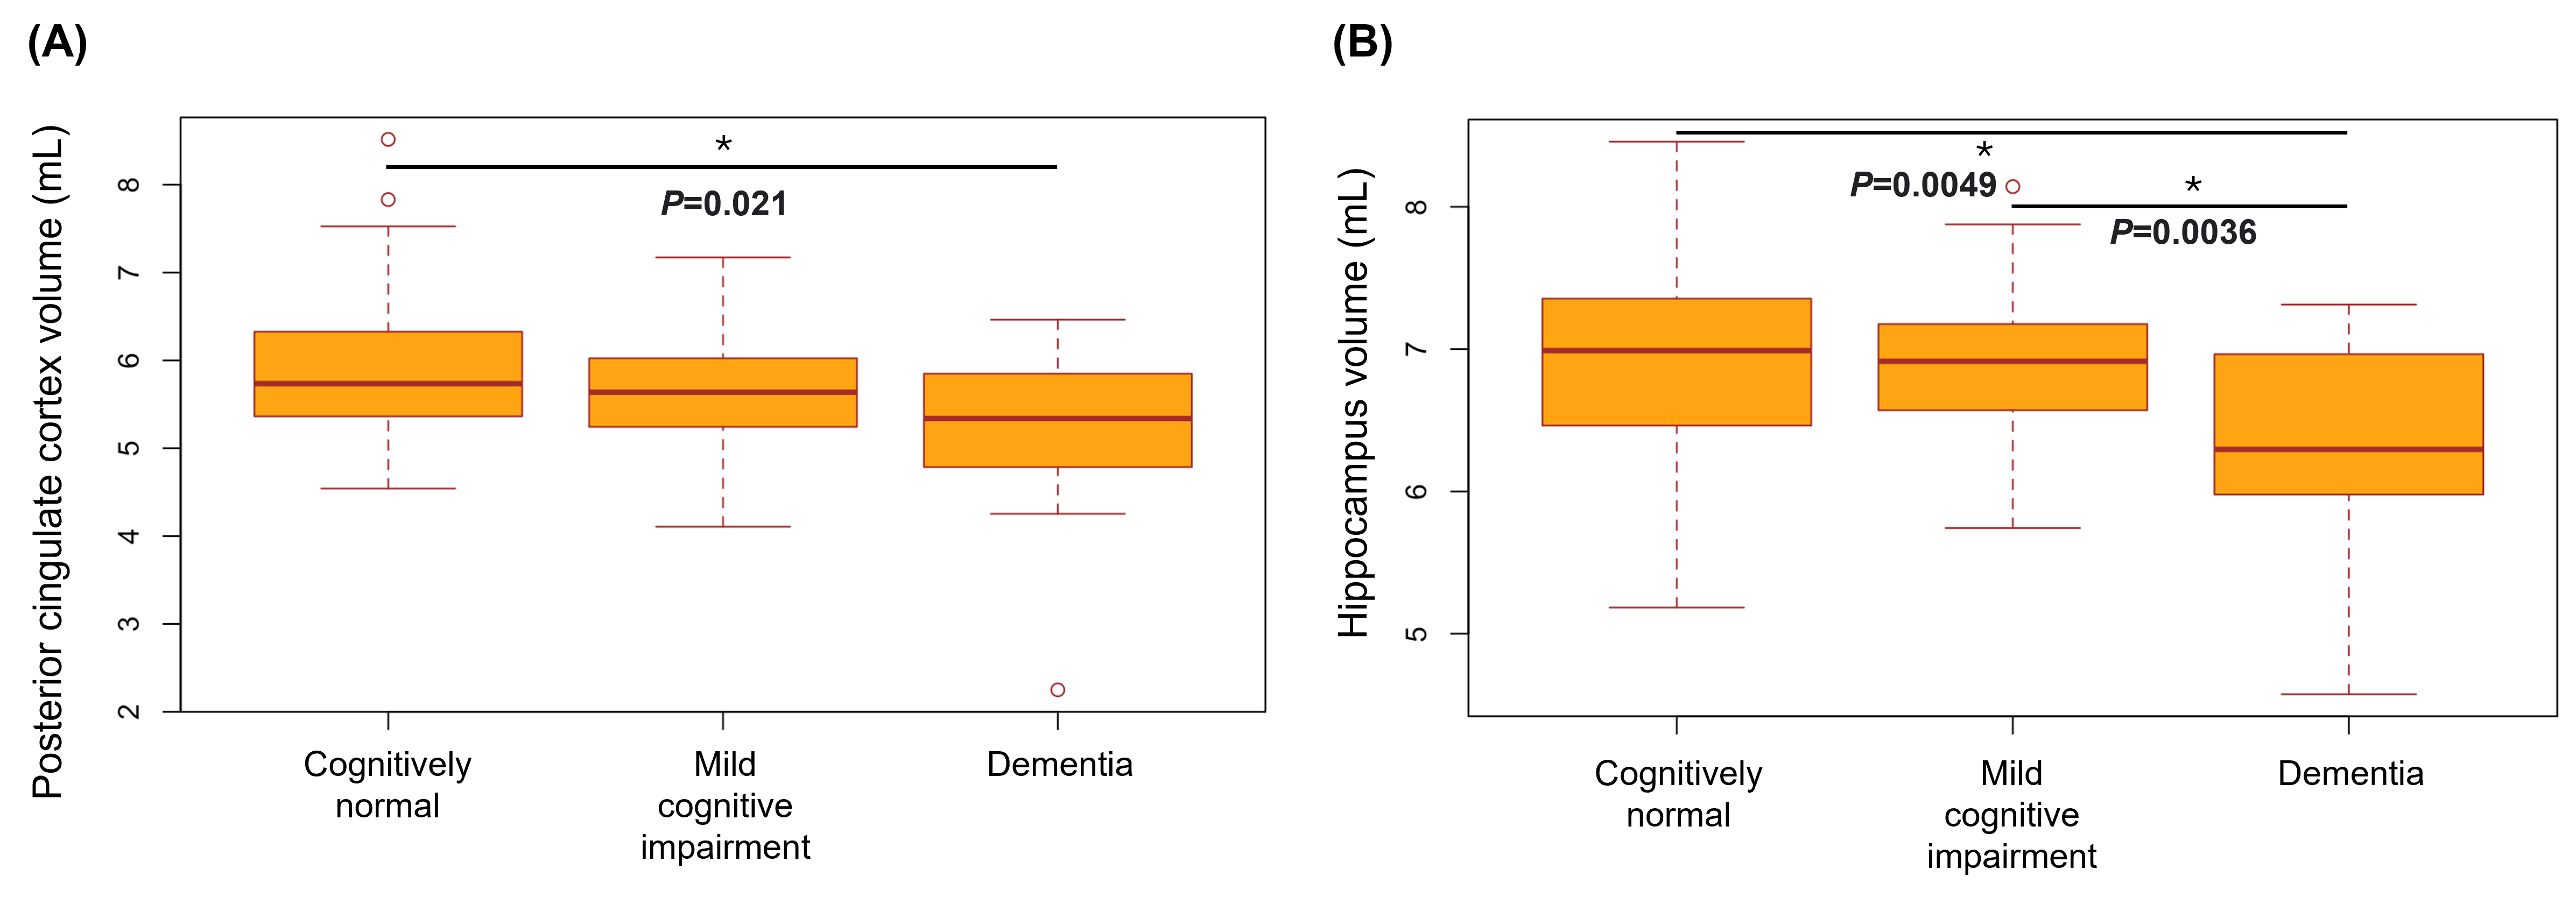
Analysis of variance assessed group differences in GM volumes between cognitively normal, MCI and dementia participants. GM volume decreased further along the dementia spectrum, especially in the posterior cingulate cortex (P=0.0279; Fig. 2A) and hippocampus (P=0.0021; Fig. 2B). Tukey post hoc pair-wise analyses showed that dementia participants had greater posterior cingulate cortex atrophy compared to cognitively normal participants (P=0.021; 95% CI -1.25 to -0.08) and greater hippocampal atrophy compared to cognitively normal (P=0.0049; 95% CI -1.05 to -0.16) and MCI (P=0.0036; 95% CI -1.02 to -0.17) participants.
Fig. 2. Group differences in AQUA-derived grey matter volumes in default mode network regions between cognitively normal, mild cognitive impairment and dementia participants. Grey matter volume decreased further along the dementia spectrum especially in the posterior cingulate cortex and hippocampus regions. Tukey post hoc analyses showed that dementia participants had greater posterior cingulate cortex atrophy compared to cognitively normal participants, and greater hippocampal atrophy compared to cognitively normal and mild cognitive impairment participants. Tukey post hoc analyses results are indicated as P<0.05.
CAT12: Computational Anatomy Toolbox; LST: Lesion Segmentation Toolbox
Subsequent multiple regression analysis indicated a significant reduction in hippocampus volume (β=-0.477; P=0.023; 95% CI -0.88 to -0.06) in dementia participants compared to cognitively normal participants even after controlling for age at visit and sex. A marginal reduction in posterior cingulate cortex volume (β=-0.467; P=0.065; 95% CI -0.96 to 0.03) was observed in dementia participants compared to cognitively normal participants even after controlling for age at visit and sex. There were no differences in precuneus and medial orbitofrontal cortex volume between the diagnostic groups in the multiple regression analyses.
DISCUSSION
In this study, we examined the usefulness of AI-based software for the automated segmentation of both T1-weighted and FLAIR images in individuals along the continuum of cognitive impairment. WMH ratings and volumes, as well as GM volumes were obtained from AQUA software and compared against human-based and standard neuroimage processing protocols at the Dementia Research Centre (Singapore). In this validation study of 90 participants with a research diagnosis of cognitively normal, MCI and dementia, we illustrated high concordance between human-based and AQUA-based visual ratings of WMH, as well as between existing automated WMH processing pipelines and AQUA. Furthermore, AQUA-based GM volumes in the default mode network showed differences between the diagnostic groups, especially in the hippocampus and posterior cingulate cortex.
Our results demonstrate a high correlation between human-based semi-quantitative visual ratings and AQUA-based ratings of WMH. This would represent the first cohort study to validate the robustness of the WMH ratings pipeline from AQUA. We also observed a high correlation between LST/CAT12 and AQUA-based WMH quantification across the syndrome stages, providing important evidence on the utility of AI-based software for the automated rating and quantification of WMH. Additionally, the time taken to carry out the WMH image processing and segmentation to determine both the rating and volume outputs was less than 20 minutes, compared to significantly longer times for human-based visual ratings, as well as LST/CAT12-based WMH quantification. Determination of visual rating scores using AQUA software also removed the subjectivity of visual ratings. Indeed, manual ratings are tedious and time-consuming and also have significant disadvantages, including large intra- and inter-observer variabilities, often ranging from 10% to 68%.13-15 Moreover, the segmentation performance of AQUA using FLAIR imaging has been developed and validated with strong correlation with human-based visual ratings across various MRI resolutions, ranging from 1 mm to 5 mm slice thickness. In this manner, an automated and quick approach such as AQUA is highly beneficial to clinicians, allowing them to make informed decisions swiftly and efficiently, without the need for time-consuming visual inspection.
When assessing the need for an automated WMH segmentation tool, there are several factors that need to be considered, including the type of scans required, the time taken for segmentation, as well as the availability of the software. In this regard, AQUA uses only the FLAIR scans to obtain WMH ratings and volume, whereas LST requires both T1-weighted and FLAIR, and CAT12 requires only the T1-weighted images. Keeping this in mind, the use of FLAIR scans only, which are the best image type for the detection of WMH, and the simplified software user experience make AQUA an alternative for the efficient rating and quantification of WMH. Indeed, recently published findings have demonstrated AQUA to have good generalisability and robustness across different datasets.24,25 In addition to this, findings from this study validate the robustness of the WMH ratings pipeline from AQUA through the high correlation between human-based visual ratings and AQUA-based ratings of WMH. Given the high prevalence of WMH in Singapore and the region, as well as its relevance in predicting the progression of dementia and cognitive impairment, accurate and timely identification of WMH is imperative for clinical outcomes and therapeutic intervention.9,10
Our findings illustrated that AQUA-based segmentation can distinguish between diagnostic groups based on their GM volumes. Specifically, GM volumes from default mode network regions of interest obtained from AQUA showed greater atrophy in dementia participants compared to cognitively normal and MCI participants. In particular, the posterior cingulate cortex and hippocampus showed significant atrophy even after controlling for age at visit and sex. Since the difference in volume of the default mode network between cognitively normal, MCI and dementia was significant, GM volumes derived from AQUA are a good representation of the neurodegenerative process seen in conditions such as Alzheimer’s disease. Notably, the segmentation of T1-weighted structural images to derive GM volume information took less than 5 minutes using the AQUA pipeline, compared to processing times of up to a few hours using other automated neuroimage processing software such as Freesurfer (Laboratory for Computational Neuroimaging, Athinoula A. Martinos Center for Biomedical Imaging, Charlestown, MA, US).22 AQUA also requires minimum technical know-how. Thus, the use of AQUA in clinical settings could assist clinicians in quantifying WMH volumes in a simple and accurate manner. In particular, development and deployment of patient- and clinician-friendly segmentation methods could enable fast and accurate diagnosis, as well as provide meaningful information on brain structure to aid the diagnosis of neurodegenerative diseases. AI algorithms could also help radiologists as a first line of screening for abnormalities, thus saving time that can be dedicated to more complex abnormalities.
Notably, the AQUA pipeline for T1-weighted MRI conducts sub-regional analysis on a larger scale (>100 regions) in a shorter processing time (<5 min) compared to that of existing tools.44 Moreover, its segmentation capabilities have been developed and validated for both East Asian and Caucasian populations, which are likely to improve applicability and generalisability. Additionally, the AQUA pipeline for T2 FLAIR also has high robustness with low-quality images or participants with severe atrophy.24 This pipeline yields automatic scoring outcomes based on the objective measurements from imaging, validated across multiple studies.24,26,27,45 Clinical cases employing these pipelines underscore their alignment with clinical manifestation, emphasising their clinical relevance and reliability.25,46 Shorter processing times would enable clinicians to examine greater number of patients more efficiently, effectively and accurately, without the need for tiresome manual visual assessments by trained raters. This would, in turn, lead to potential reduction in healthcare cost, in addition to time savings, as well as help tackle the shortage of qualified radiologists.23,47
Limitations
Our study has some limitations. Our analyses were based on cross-sectional data with a moderate sample size. Due to the moderate sample size of some of our diagnostic groups, potential type II errors in subgroup comparisons are a likely limitation of this study. Thus, these findings need to be further validated using a larger and longitudinal dataset to further examine the suitability of AI-based software such as AQUA for patient-related outcomes. This must be taken into consideration prior to clinical implementation. Additionally, a research diagnosis was used to categorise participants along the dementia spectrum. In this regard, future biomarker-supported studies will provide greater insights into the association between AQUA-based brain changes and more comprehensive diagnosis. We also did not control for the presence of vascular risk factors in our analyses. Future analyses can take into consideration the impact of vascular risk factors, especially on the detection and quantification of WMH.
CONCLUSION
In summary, this validation study indicated the usefulness of AQUA in a community-based research cohort for cognitive impairment and its ability to efficiently quantify WMH burden and GM atrophy changes in cognitively normal, MCI and dementia participants. The AQUA software showed a high correspondence with existing automated pipelines but was much faster and simpler in execution, thus making it a good candidate for clinical settings. Larger longitudinal studies using AQUA segmentation will enable the validation of baseline AQUA-based brain measures, such as GM and WMH volume, for predicting the progression of cognitive decline and conversion from MCI to dementia, which will be imperative for its clinical implementation.
Fig. S1. Example of Neurophet AQUA T1 segmentation results.
Availability of data and materials
Anonymised data will be shared by request from any qualified investigator.
REFERENCES
- Karas GB, Scheltens P, Rombouts SARB, et al. Global and local gray matter loss in mild cognitive impairment and Alzheimer’s disease. Neuroimage 2004;23:708-16.
- Campbell NL, Unverzagt F, LaMantia MA, et al. Risk Factors for the Progression of Mild Cognitive Impairment to Dementia. Clin Geriatr Med 2013;29:873-93.
- Lam BYK, Yiu B, Ampil E, et al. High burden of cerebral white matter lesion in 9 Asian cities. Scientific Reports 2021;11:1-12.
- Kloppenborg RP, Nederkoorn PJ, Geerlings MI, et al. Presence and progression of white matter hyperintensities and cognition: a meta-analysis. Neurology 2014;82:2127-38.
- Prins ND, Scheltens P. White matter hyperintensities, cognitive impairment and dementia: an update. Nat Rev Neurol 2015;11:157-65.
- Prasad K, Wiryasaputra L, Ng A, et al. White matter disease independently predicts progression from mild cognitive impairment to Alzheimer’s disease in a clinic cohort. Dement Geriatr Cogn Disord 2011;31:431-4.
- Kumar D, Yatawara C, Wang B, et al. APOE4 and Confluent White Matter Hyperintensities Have a Synergistic Effect on Episodic Memory Impairment in Prodromal Dementia. J Alzheimers Dis 2022;8:1103-14.
- Catindig JAS, Venketasubramanian N, Ikram MK, et al. Epidemiology of dementia in Asia: insights on prevalence, trends and novel risk factors. J Neurol Sci 2012;321:11-6.
- Vipin A, Satish V, Saffari SE, et al. Dementia in Southeast Asia: influence of onset-type, education, and cerebrovascular disease. Alzheimers Res Ther 2021;13:195.
- Heng LC, Lim SH, Foo H, et al. Confluent white matter in progression to Alzheimer dementia. Alzheimer Dis Assoc Disord 2021;35:8-13.
- Nichols E, Steinmetz JD, Vollset SE, et al. Estimation of the global prevalence of dementia in 2019 and forecasted prevalence in 2050: an analysis for the Global Burden of Disease Study 2019. Lancet Public Health 2022;7:e105-25.
- Subramaniam M, Abdin E, Asharani PV, et al. Prevalence of dementia in Singapore: Changes across a decade. Alzheimers Dement 2025;21:e14485
- Grimaud J, Lai M, Thorpe J, et al. Quantification of MRI lesion load in multiple sclerosis: A comparison of three computer-assisted techniques. Magn Reson Imaging 1996;14:495-505.
- Zijdenbos AP, Forghani R, Evans AC. Automatic “pipeline” analysis of 3-D MRI data for clinical trials: Application to multiple sclerosis. IEEE Trans Med Imaging 2002;21:1280-91.
- Styner M, Lee J, Chin B, et al. 3D Segmentation in the Clinic: A Grand Challenge II: MS lesion segmentation. The MIDAS Journal 2022.
- Gaser C, Dahnke R, Thompson PM, et al. CAT – A Computational Anatomy Toolbox for the Analysis of Structural MRI Data. Gigascience 2024;13:giae049.
- Schmidt P, Gaser C, Arsic M, et al. An automated tool for detection of FLAIR-hyperintense white-matter lesions in Multiple Sclerosis. Neuroimage 2012;59:3774-83.
- Zhu W, Huang H, Zhou Y, et al. Automatic segmentation of white matter hyperintensities in routine clinical brain MRI by 2D VB-Net: A large-scale study. Front Aging Neurosci 2022;14:915009.
- Barnett M, Wang D, Beadnall H, et al. A real-world clinical validation for AI-based MRI monitoring in multiple sclerosis. NPJ Digit Med 2023;6:196.
- Buchner JA, Kofler F, Etzel L, et al. Development and external validation of an MRI-based neural network for brain metastasis segmentation in the AURORA multicenter study. Radiother Oncol 2023;178:109425.
- Song J, Hahm J, Lee J, et al. Comparative validation of AI and non-AI methods in MRI volumetry to diagnose Parkinsonian syndromes. Sci Rep 2023;13:3439.
- Lee H, Kim HW, Lee M, et al. Evaluating brain volume segmentation accuracy and reliability of FreeSurfer and Neurophet AQUA at variations in MRI magnetic field strengths. Sci Rep 2024;14:24513.
- Lu SL, Xiao FR, Cheng JCH, et al. Randomized multi-reader evaluation of automated detection and segmentation of brain tumors in stereotactic radiosurgery with deep neural networks. Neuro Oncol 2021;23:15600-8.
- Lee S, Rieu ZH, Kim RE, et al. Automatic segmentation of white matter hyperintensities in T2-FLAIR with AQUA: A comparative validation study against conventional methods. Brain Res Bull 2023;205:110825.
- Kim HW, Rieu Z, Kim D, et al. Clinical Utilization of Brain Magnetic Resonance Imaging-Based Artificial Intelligence Software in the Spectrum of Alzheimer’s Disease: Case Series. J Korean Neuropsychiatr Assoc 2023;62:86-94.
- Kim REY, Lee M, Kang DW, et al. Increased Likelihood of Dementia with Coexisting Atrophy of Multiple Regions of Interest. J Alzheimers Dis 2024;97:259-71.
- Kim RE, Lee M, Kang DW, et al. Effects of education mediated by brain size on regional brain volume in adults. Psychiatry Res Neuroimaging 2023;330:111600.
- Rieu ZH, Kim REY, Lee M, et al. A Fully Automated Visual Grading System for White Matter Hyperintensities of T2-Fluid Attenuated Inversion Recovery Magnetic Resonance Imaging. J Integr Neurosci 2023;22:57.
- Tan JP, Li N, Gao J, et al. Optimal cutoff scores for dementia and mild cognitive impairment of the Montreal Cognitive Assessment among elderly and oldest-old Chinese population. J Alzheimers Dis 2015;43:1403-12.
- Ng A, Chew I, Narasimhalu K, et al. Effectiveness of Montreal Cognitive Assessment for the diagnosis of mild cognitive impairment and mild Alzheimer’s disease in Singapore. Singapore Med J 2013;54:616-9.
- Kandiah N, Zhang A, Cenina AR, et al. Montreal Cognitive Assessment for the screening and prediction of cognitive decline in early Parkinson’s disease. Parkinsonism Relat Disord 2014;20:1145-8.
- Nasreddine ZS, Phillips NA, Bédirian V, et al. The Montreal Cognitive Assessment, MoCA: a brief screening tool for mild cognitive impairment. J Am Geriatr Soc 2005;53:695-9.
- Lee M, Kim J, Kim REY, et al. Split-Attention U-Net: A Fully Convolutional Network for Robust Multi-Label Segmentation from Brain MRI. Brain Sci 2020;10:974.
- Rieu ZH, Kim JY, Kim REY, et al. Semi-Supervised Learning in Medical MRI Segmentation: Brain Tissue with White Matter Hyperintensity Segmentation Using FLAIR MRI. Brain Sci 2021;11:720.
- Fazekas F, Chawluk JB, Alavi A. MR signal abnormalities at 1.5 T in Alzheimer’s dementia and normal aging. AJR Am J Roentgenol 1987;149:351-6.
- Ashburner J, Friston KJ. Unified segmentation. Neuroimage 2005;26:839-51.
- Ashburner J. A fast diffeomorphic image registration algorithm. Neuroimage 2007;38:95-113.
- Mangin JF, Regis J, Frouin V. Shape bottlenecks and conservative flow systems [medical image analysis]. Proceedings of the Workshop on Mathematical Methods in Biomedical Image Analysis, San Francisco, CA, US 1996;319-28.
- Dahnke R, Yotter RA, Gaser C. Cortical thickness and central surface estimation. Neuroimage 2013;65:336-48.
- Ashburner J, Friston KJ. Diffeomorphic registration using geodesic shooting and Gauss-Newton optimisation. Neuroimage 2011;55:954-67.
- Penny W, Friston K, Ashburner J, et al. Statistical Parametric Mapping: The Analysis of Functional Brain Images. 1st Ed. Amsterdam/Boston: Elsevier/Academic Press; 2007.
- De Marco M, Manca R, Mitolo M, et al. White Matter Hyperintensity Load Modulates Brain Morphometry and Brain Connectivity in Healthy Adults: A Neuroplastic Mechanism? Neural Plast 2017;40505.
- Buckner RL, Andrews-Hanna JR, Schacter DL. The brain’s default network: anatomy, function, and relevance to disease. Ann N Y Acad Sci 2008;1124:1-38.
- Pemberton HG, Zaki LAM, Goodkin O, et al. Technical and clinical validation of commercial automated volumetric MRI tools for dementia diagnosis-a systematic review. Neuroradiology 2021;63:1773-89.
- Kim HW, Rieu Z, Lee H, et al. White Matter Lesion Asymmetry: A Potential Indicator of Amyloid Positivity in Patients with Mild Cognitive Impairment. Alzheimer’s & Dementia 2023;19:e082908.
- Kim HW, Kim HJ, Lee H, et al. Magnetic resonance image-based brain age as a discriminator of dementia conversion in patients with amyloid-negative amnestic mild cognitive impairment. Sci Rep 2023;13:1-10.
- Allyn J; Radiological Society of North America. International Radiology Societies Tackle Radiologist Shortage. 19 February 2020. https://www.rsna.org/news/2020/february/international-radiology-societies-and-shortage. Accessed 5 August 2025.
The study was approved by Nanyang Technological University Institutional Review Board (2021-1036).
All participants provided informed consent in accordance with the Declaration of Helsinki. Nagaendran Kandiah received honoraria and research funding from Neurophet Inc. All other authors declare that they have no competing interests. Individuals from Neurophet Inc. are co-authors on this manuscript and helped install the software as well as provide input on software specifications for the manuscript. They did not have any role in study design, data analysis or reporting of results.
Assoc Prof Nagaendran Kandiah, Dementia Research Centre (Singapore), Lee Kong Chian School of Medicine, Nanyang Technological University, 11 Mandalay Road, Singapore 308232. Email: [email protected]
