

ABSTRACT
Introduction: The 30-day readmission rate for chronic obstructive pulmonary disease (COPD) is a common performance metric but may be confounded by factors unrelated to quality of care. Our aim was to assess how sociodemographic factors, multimorbidity and frailty impact 30-day readmission risk after COPD hospitalisation, and whether risk adjustment alters interpretation of temporal trends.
Method: This is a retrospective analysis of administrative data from October 2017 to June 2023 from Changi General Hospital, Singapore. Multivariable mixed-effects logistic regression models were used to estimate unadjusted and risk-adjusted 30-day readmission odds. Covariates included age, sex, race, Charlson Comorbidity Index (CCI), Hospital Frailty Risk Score (HFRS) and year. Temporal trends in readmission risk were compared across unadjusted and adjusted models.
Results: Of the 2774 admissions, 749 (27%) resulted in 30-day readmissions. Higher CCI (CCI≥4 versus [vs] CCI=1: adjusted odds ratio [aOR] 2.00, 95% confidence interval [CI] 1.33–2.99, P=0.003; CCI 2–3 vs CCI=1: aOR 1.50, 95% CI 1.15–1.96, P=0.001) and higher HFRS (≥5 vs <5: aOR 1.29, 95% CI 1.01–1.65, P=0.04) were independently associated with increased readmission risk. While unadjusted analyses showed no significant temporal trends, the risk-adjusted model revealed a 32–35% reduction in readmission odds in 2021–2023 compared to baseline.
Conclusion: Multimorbidity and frailty significantly impact COPD readmissions. Risk adjustment revealed improvements in readmission risk not evident in unadjusted analyses, emphasising the importance of applying risk adjustments to ensure valid performance metrics.
CLINICAL IMPACT
What is New
- Risk adjustment in hospital benchmarking enhances performance measures by accounting for case mix complexity, yet empirical evidence is lacking to support its use in the Singapore healthcare system.
- This study provides empirical data demonstrating that adjusting for clinical complexity and frailty reveals hidden improvements in 30-day readmission risk after COPD hospitalisation in Singapore.
Clinical Implications
- Incorporating risk adjustment ensures fairer evaluations of care quality, guiding policy and interventions to reduce avoidable readmissions.

Chronic obstructive pulmonary disease (COPD) is a chronic respiratory condition defined by persistent respiratory symptoms and airflow limitation.1 It is primarily caused by pathological changes in the airways and alveoli due to prolonged exposure to noxious gases and particles, such as cigarette smoke and particulate matter from air pollution.1,2 COPD affects approximately 292 million people globally and is the third leading cause of death worldwide.2
From a healthcare system perspective, COPD is a significant contributor to hospitalisations.3,4 Hospital readmissions following an initial hospitalisation for acute COPD exacerbation are common,5 with all-cause 30-day readmission rates reported to range between 7.3% and 38.0%.6
The 30-day readmission rate reflects adverse health outcomes requiring rehospitalisation within the early post-discharge period. This metric provides an opportunity to address avoidable readmissions through interventions initiated during the index admission. Examples include guideline-directed clinical management, comprehensive discharge planning, care coordination, and the provision of community support services.7 Consequently, the 30-day readmission rate is widely used as a quality-of-care indicator,8 and its public reporting is mandated in several countries.
In some healthcare systems, financial incentives and penalties tied to 30-day readmission rates aim to enhance accountability and encourage the delivery of safe and effective care.7,9 In the US, under Medicare Hospital Readmissions Reduction Program, hospitals with excess 30-day readmissions for COPD and other chronic conditions face financial penalties.10 Similarly, the UK’s National Health Service does not reimburse hospitals for unplanned, avoidable readmissions within 30 days if these exceed a threshold rate.11 In Denmark and Germany, index admissions and related readmissions are bundled into a single case for payment purposes, incentivising hospitals to minimise preventable readmissions.9,12
One key concern is the validity of crude 30-day readmission rates as a healthcare performance metric, because readmission rates can be affected by factors unrelated to quality of care. Patients with higher medical or social vulnerabilities, such as those with multiple comorbidities or frailty, have an elevated risk of readmission.6,7,13 Consequently, hospitals serving a higher proportion of such patients may appear to perform worse on this metric, regardless of the quality of care provided. Without accounting for differences in patient case-mix, performance assessments may be distorted, hindering the adoption of best practices. This is especially crucial when comparing performance across different hospitals, as they may cater to populations with significantly varied risk profiles.14
To address this issue, risk adjustment methodologies have been developed to account for confounding factors, such as patient demographics, comorbidities and illness severity, when calculating readmission rates.15 By promoting fairer and more accurate comparisons of health outcomes, risk adjustment ensures that observed differences reflect variations in care quality rather than disparities in patient risk profiles.
In Singapore, limited data exist regarding the extent to which patient characteristics contribute to variability in COPD 30-day readmission rates. Additionally, it is unclear whether such variability warrants risk adjustment to ensure accurate interpretation of these rates. The 2024 Technical Manual for Healthier SG Indicators states that use of risk adjustment for condition-specific readmission rates (including COPD) is to be determined.16 With a growing emphasis on value-based care, a nuanced understanding of the factors influencing 30-day readmissions is essential for developing equitable and effective healthcare policies.
This study aimed to evaluate whether patient characteristics—including sociodemographic factors, multimorbidity and frailty—are associated with 30-day readmission risk following hospitalisation for COPD exacerbation. Furthermore, we examined whether risk adjustment qualitatively alters the interpretation of 30-day readmission rates, particularly in the context of assessing care quality over time.
METHOD
Study design and study population
This was a retrospective cohort study. The analytic dataset was extracted from Changi General Hospital, Singapore, a 1000-bed, university-affiliated, public tertiary hospital in Singapore. The hospital manages approximately 500 admissions for acute exacerbation of COPD annually, similar to other public general hospitals in the country. The data warehouse collected clinical and administrative data from all COPD patients accessing care at the hospital, with daily data updates. Variables captured include sociodemographic factors, administrative visit details, diagnostic codes, laboratory and radiology results, and prescribed medications.
Inclusion criteria for this analysis were: all adults (>18 years) hospitalised for a primary diagnosis of COPD, identified by the International Classification of Disease (ICD-10) codes J44 and its subcodes, between 1 October 2017 and 30 June 2023.
Variables and measures
The primary outcome was 30-day readmission, defined as a binary variable indicating whether there was an all-cause readmission within 30 days of an index COPD admission COPD. The 30-day readmission rate was defined as the proportion of index admissions for COPD (J44 diagnostic code), which were followed by an all-cause readmission within 30 days, expressed as a percentage (%).
Covariates of interest included age, sex, race, the Charlson Comorbidity Index (CCI), the Hospital Frailty Risk Score and calendar year. Age was categorised as ≤59, 60–69, 70–79 and ≥80 years. Sex was categorised as male or female. Self-reported race was categorised as Chinese, Malay, Indian or others. The CCI is a validated composite measure of comorbidity burden or multimorbidity, encompassing 17 different diagnostic domains, including cardiovascular, respiratory, liver, metabolic and malignant conditions.17 Each domain contributes a weighted score to the index. In this study, the CCI was computed based on ICD-10 codes recorded within the previous year of the index admission, and categorised into 1, 2–3, or ≥4 for analysis. The HFRS is a summed weighted score based on >100 ICD-10 codes indicative of frailty,18 and was parameterised as a categorical variable <5 or ≥5. Calendar year was categorised into bins: 2017–2018, 2019, 2020, 2021 and 2022–23. Data were pooled for October 2017 to December 2018 and January 2022 to June 2023 due to availability of <1 year of data in 2017 and 2023.
Statistical analysis
Data was expressed as mean ± standard deviation for continuous variables, and number (%) for categorical variables.
To assess the risk of 30-day readmission, we modelled the log-odds of 30-day readmission using mixed-effects logistic regression, with a random intercept to account for within-patient clustering of admissions. The intraclass correlation (ICC) and likelihood ratio test comparing a null mixed-effects versus (vs) a null standard logistic model were used to assess significant clustering. An ICC>0.05 and a likelihood ratio test P value of <0.05 were taken as evidence for significant clustering.
Unadjusted and adjusted fixed effects estimates for covariates were computed. Odds ratios with confidence intervals that did not include 1 were interpreted as evidence of statistically significant association with 30-day readmission.
To evaluate temporal trends, we examined the odds ratio [OR] for each year bin, with OR of <1 indicating lower risk of readmission compared to the baseline epoch (2017–2018). We evaluated whether applying risk adjustment, compared to unadjusted analyses, qualitatively altered the interpretation of temporal trends in 30-day readmission risk.
As sensitivity analyses, we included the additional covariate of ward class in regression modelling as a pragmatic proxy for socioeconomic status.
Statistical analyses and regression models were performed in R with the lme4 package.
Ethics
This study was classified as a service evaluation and deemed not to require ethical review by the SingHealth Centralised Institutional Review Board (2018/2698) as per applicable ethical and regulatory standards.
RESULTS
Study population and index admissions
During the study period, a total of 2906 index admissions for COPD were identified. Among these, 132 index admissions were excluded due to in-hospital mortality during the same admission, resulting in 2774 index admissions available for analysis of 30-day readmission. Complete data on covariates were available for all 2774 entries. These admissions corresponded to 1119 unique patients.
Characteristics of patients at index admission are summarised in Table 1. An increasing age trend was observed with ascending CCI and HFRS categories. Additionally, admissions with higher CCI categories were associated with correspondingly elevated HFRS categories, demonstrating a positive relationship between these indices. The most prevalent CCI conditions were diabetes with (11.2%) and without (20.8%) complications, moderate-to-severe chronic kidney disease (13.7%), congestive heart failure (8.1%) and myocardial infarction (6.6%). The most prevalent HFRS conditions were Alzheimer’s disease (7.1%), delirium (3.5%) and tendency to fall (1.8%).
30-day readmissions
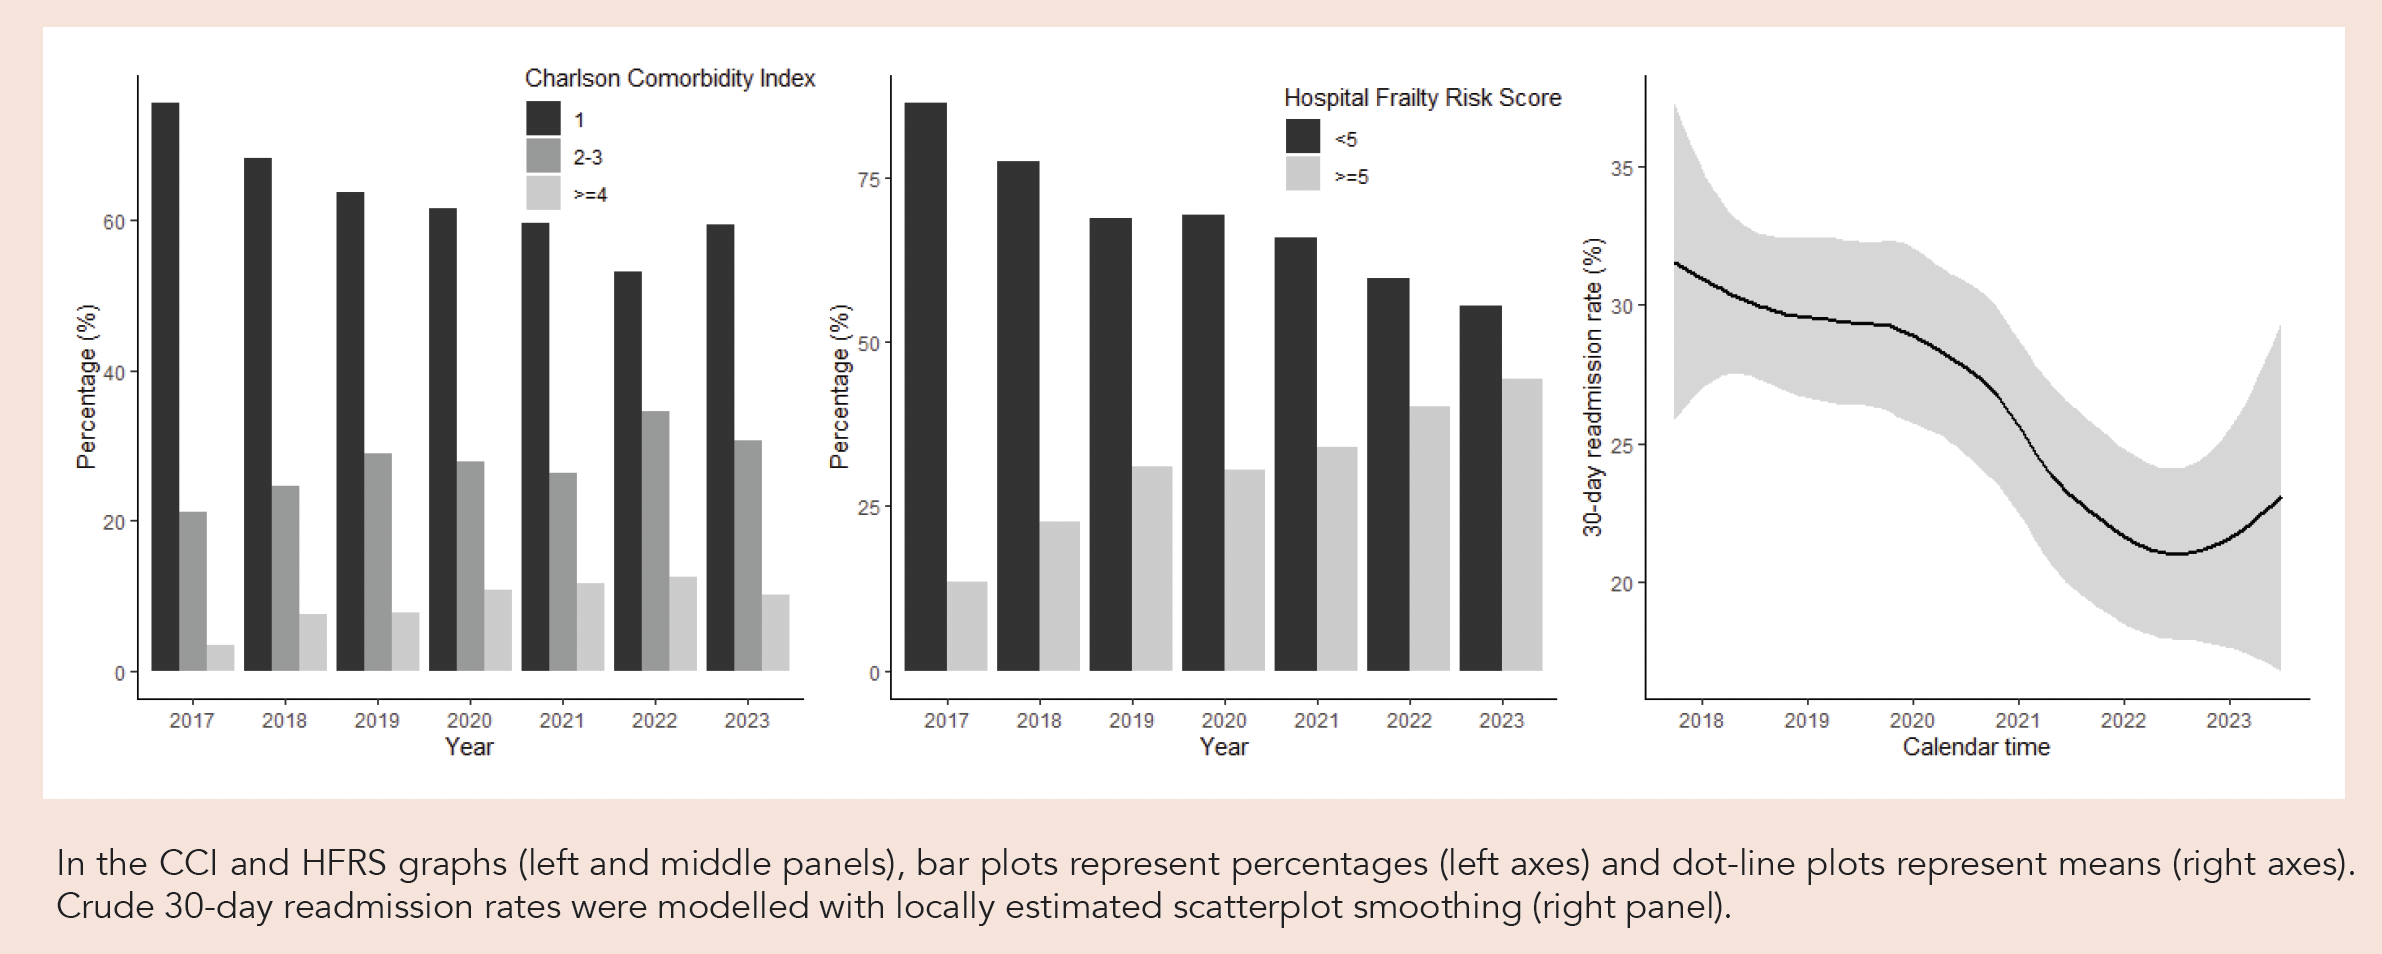
Out of the 2774 index admissions, 749 (27%) were readmitted within 30 days. Crude readmission rates each annum were 31% (2017–2018), 28% (2019), 30% (2020), 22% (2021) and 21% (2022–2023). Significant clustering of admissions among individuals was observed, evidenced by the ICC of 0.28, and likelihood ratio test P value of <0.001 when comparing the null mixed-effects model to the null standard logistic regression model. Among the 1119 unique patients, 795 (71.0%) had zero 30-day readmissions, 191 (17.6%) had one 30-day readmission, and 133 (11.1%) had two or more 30-day readmissions over the study period.
Stratified analyses showed that 30-day readmission rates were 24.2%, 31.2% and 34.0% for CCI of 1, 2–3 and ≥4, respectively. Similarly, readmission rates were 25.5% and 30.4% for HFRS <5 and HFRS ≥5, respectively. In the fully risk-adjusted model (Table 2), a CCI of 2–3 (adjusted odds ratio [aOR]: 1.50, 95% confidence interval [CI] 1.15–1.96, P=0.003) and ≥4 (aOR: 2.00, 95% CI 1.33–2.99, P=0.001) were associated with significantly higher odds of 30-day readmission, compared to the reference category of CCI=1. Similarly, an HFRS score of ≥5 was significantly associated with increased odds of 30-day readmission compared to <5 (aOR: 1.29, 95% CI 1.01–1.65, P=0.04). Patient age, sex and race were not significantly associated with 30-day readmission.
Table 2. Unadjusted and risk-adjusted models.
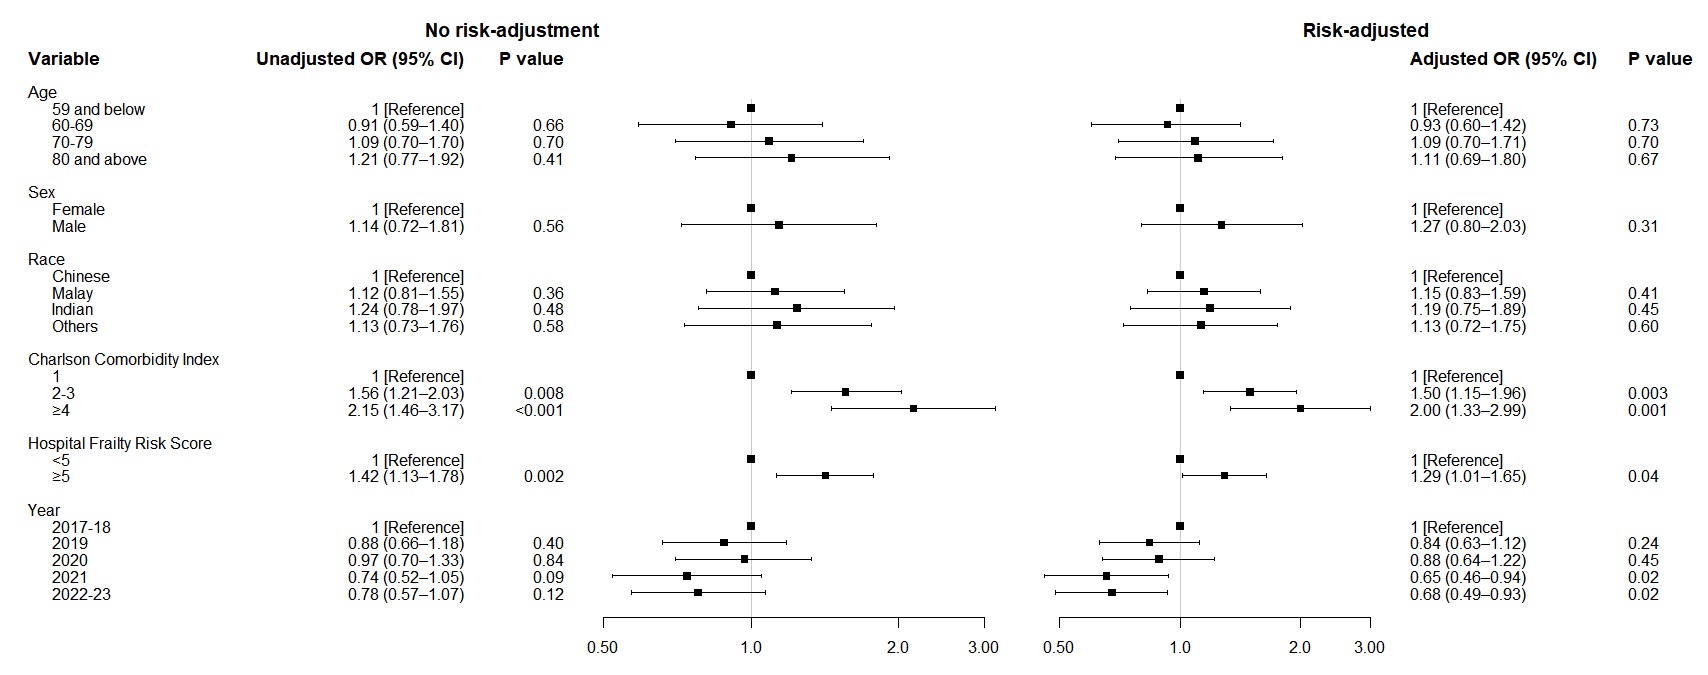
Fig. 1. Temporal trends for Charlson Comorbidity Index (CCI), Human Frailty Risk Score (HFRS) and 30-day readmission rates with 95% confidence intervals.
Temporal trends
There was an increasing proportion of patients with higher CCI and HFRS scores over time (Fig. 1, left and middle panels). Despite the rising multimorbidity and frailty burden, an apparent decline in 30-day readmission rate was observed visually (Fig. 1, right panel). However, unadjusted analyses (Table 1) showed no significant reduction in the odds of readmission over time. In contrast, the fully risk-adjusted analyses (Table 1) revealed a significantly reduced risk of 30-day readmission in 2021 (aOR: 0.65, 95% CI 0.46–0.94, P=0.02) and 2022–2023 (aOR: 0.68, 95% CI 0.49–0.93, P=0.02) compared to the baseline period. These findings correspond to a 32–35% reduction in the risk-adjusted odds of 30-day readmission, indicating that risk-adjustment unmasked improvements in this quality metric over time.
In sensitivity analyses with additional adjustment for ward class (Supplementary Table S1), ward class was not significantly associated with 30-day readmission risk. Associations of CCI and HFRS with readmission remained significant, and the reduced readmission risk in 2021 and 2022–2023 was maintained.
DISCUSSION
To better understand and interpret the 30-day readmission rate as a healthcare quality measure, this study investigated variations in COPD 30-day readmission risk attributable to case mix factors including demographics, multimorbidity and frailty. These variables reflect the intrinsic risk of the patient population managed by the hospital, distinct from the quality of care that the metric is intended to measure. Our analysis demonstrated an increasing trend of comorbidity burden and frailty from 2017 to 2023, reflecting an ageing patient population with escalating levels of multimorbidity and functional impairment. Compared to a CCI of 1, a CCI score of 2–3 was associated with a 50% higher odds of 30-day readmission, while a CCI of ≥4 was associated with a 100% higher odds. Similarly, HFRS ≥5 was associated with 29% increase in readmission odds compared to HFRS <5. Although unadjusted 30-day readmission risk showed no statistically significant improvement over time, risk-adjusted analyses revealed a statistically significant 32–35% reduction in readmission odds during the later years of the study, highlighting improvements in performance over the study period. These findings underscore the importance of risk adjustments in ensuring fair and meaningful interpretation of healthcare quality indicators.
Risk-adjusted readmission rates derived through regression modelling of administrative claims from Medicare and Medicaid hospitals were first publicly reported in the US in 2009 for a limited number of conditions.19 In subsequent years, risk-adjusted readmission rates were expanded to a range of other chronic conditions, including COPD,20 and used to determine value-based payments to hospitals under the Hospital Readmissions Reduction Program.10 The US risk-adjustment methodology applies demographic variables and specific comorbidities in the previous 12 months as covariates in the statistical model.10 Risk-adjusted readmission rates were expressed as the ratio of a hospital’s predicted performance relative to the national expected average for the same case mix, which is in turn multiplied by the observed national readmission rate,10 hence providing a metric for benchmarking. Internationally, the practice of risk adjustment varies: Germany and the UK do not adjust for risk, while Australia stratifies by hospital peer group rather than using regression modelling.7 While the core concept of risk adjustment is good practice and relevant to Singapore’s healthcare system, direct adoption US risk-adjusted models without modification may be inappropriate due to differences in systems and populations. To our knowledge, our study is the first to provide empirical support for risk-adjusted benchmarking in Singapore, identifying key factors influencing performance assessment which should be incorporated in risk adjustment in our setting. Unlike US models that adjust for specific comorbidities, we used validated indices of comorbidity and frailty captured from administrative visit data, offering a simpler and more intuitive approach. Furthermore, while US studies typically assess the impact of risk adjustment on hospital rankings at a single time point,21-23 our study tracked changing multimorbidity and frailty levels over time, revealing otherwise unrecognised longitudinal trends in readmission risk. Our findings highlight that, beyond hospital rankings, risk adjustment has a role in longitudinal assessment of healthcare performance.
We examined all-cause 30-day readmissions following COPD admissions, reporting an average of 27% over 7 years, decreasing from 31% in 2017–2018 to 21% in 2022–2023. The all-cause readmission rate was used because any unplanned readmission is undesirable for patients, and inferring quality of care from only the documented reason for readmission is difficult.20 Comparisons with published data require caution due to substantial variability in COPD readmission definitions.5 Many studies define readmission based on only COPD- or respiratory-related diagnoses, yielding lower readmission rates.24 Others use different denominators, such as unique patients versus total admissions.5 Additional methodological differences include handling of inter-hospital transfers, episode consolidations due to billing practices, discharges against advice, and eligibility of consecutive admissions as new index events.20 To our knowledge, only one published study from Singapore25 has reported COPD 30-day readmission rates, documenting an incidence rate of 0.12 per person-year in 2008–2009 among patients enrolled in a chronic disease management programme. However, direct comparison with our study is limited by differences in outcome definition (COPD-specific versus all-cause readmissions) and methodological approach (incidence rate versus proportion of readmissions per index admission). In 2022, crude 30-day readmission rates following COPD admission from 3 local hospitals ranged between 24–32% (unpublished data), but it is not known whether risk adjustment would lead to narrowing of this range of variability. Internationally, a meta-analysis reported 30-day all-cause readmission rates ranging between 7.3% and 38.0%, but these estimates are likely biased, because included studies considered readmissions due only to COPD, or used highly selected clinical cohorts (for example, excluding patients >65 years, or including patients on specific treatments).26 In addition, the meta-analysis did not account for different methodologies used to compute readmission rates. Thus, standardisation of readmission definition and risk adjustment methodology is needed for meaningful benchmarking.
Our study was not designed to evaluate the causal factors underlying readmission rate improvements. Outcome indicators such as the readmission rates, while providing an indication of quality of care,8 do not inherently reveal which aspects of care influenced outcome.27 Specific care processes (e.g. guideline-based treatment, patient education) and administrative factors (e.g. staffing ratios, medication subsidies) are better assessed through process and structural indicators.27 A comprehensive quality improvement programme should generally include a mix of outcome, process and structural indicators.27 Within this context, outcome indicators provide broad measures of the net effectiveness of healthcare, capturing both measured and unmeasured care processes and structural factors affecting patient outcomes.19 The additional value of outcome measures is that they are directly relevant to patient experience, for example, readmission rates are disruptive and costly to patients.28 The challenge lies in ensuring that operationalisation of outcome indicators (like the readmission rate) accurately captures quality of care, while accounting for factors beyond clinical control or hospital jurisdiction, such as intrinsic clinical complexity29 and social determinants.
Several factors, both unrelated and related to quality of care, may have contributed to the observed decline in readmission risk. Coding practices, such as coding more comorbidities, could artificially lower readmission risk.30 Additionally, secular trends, including global declines in COPD admissions during the COVID-19 pandemic,31 could have influenced readmission rates. However, our study found no significant decrease in readmission risk in 2020 despite the stringent public health measures implemented that year, nor a rebound in readmission risk in 2022 when restrictions were eased, suggesting that pandemic-related factors were not the primary drivers of observed trends. Temporal improvements in readmission risk may also reflect enhancements in care quality driven by targeted clinical and population health interventions implemented at our hospital. For example, COPD-specific quality indicators—including 30-day readmission rates, mortality rates and length of stay—are routinely tracked using a dashboard. Process outcomes, such as disease education, inhaler technique, smoking cessation, pulmonary rehabilitation uptake and vaccinations, are also monitored on this dashboard and shared with stakeholders, with a clear chain of accountability. Multidisciplinary teams support the implementation of quality improvement initiatives, including adherence to best-practice guidelines through integrated clinical pathways within electronic health records. Specific quality improvement projects that have been undertaken at our hospital include interventions to increase the prescribing of inpatient influenza vaccination, and a multidisciplinary health management unit (comprising clinicians, allied health practitioners, case managers, social workers and community partners) that meets monthly to identify high-risk patients for discussion and provide clinical, behavioural and social management plans with the aim of preventing readmissions.
This report comes at a pivotal time for the Singapore healthcare system, which is transitioning from a fee-for-service to a value-driven care model that holds hospitals increasingly accountable for quality of care. Quality measures are integral to enhancing healthcare value and effectiveness, but their development, measurement and benchmarking require meticulous consideration. Failure to account for confounding by case mix may lead to biased conclusions and hinder the intended goal of improved population health outcomes. An example is the Hospital Readmissions Reduction Program in the US that initially used incomplete risk-adjustment in the reporting and adjudication of 30-day readmission rates by failing to include social risk, leading to the unintended consequence of penalising hospitals serving disadvantaged populations, thereby potentially widening disparities of health.32
To address this problem, risk adjustment is a best-practice approach to enable accurate assessment of performance, by applying statistical methods such as stratification, standardisation or regression modelling as in this study.15 Risk-adjusted metrics facilitate meaningful benchmarking across healthcare institutions, encouraging active collaboration and adoption of best practices. In addition, by adjusting for factors outside a provider’s control, risk-adjusted metrics focus on aspects of care that can be influenced or improved, enhancing accountability for quality. Policymakers can also use risk-adjusted data to make informed decisions about resource allocation and payment incentives in value-based care models.
This study has several limitations. First, while we demonstrated that risk adjustment can substantively alter the qualitative interpretation of the 30-day readmission metric, data from other hospitals in Singapore were not available for us to evaluate how risk adjustment affects interhospital comparisons. This single-centre study may also not be generalisable to other centres or countries.
Second, our study used summary indices of multimorbidity and frailty, the CCI and HFRS, instead of individual comorbidities. While incorporating individual comorbidities as covariates could better delineate their specific causal associations with readmission risk—an approach suited for identifying novel risk factors—our study had a different primary objective of providing empirical support to justify risk adjustment of performance metrics in Singapore. Each individual comorbidity likely exerts only a minor influence on readmission risk, and including numerous comorbidities as covariates would have compromised model parsimony. Besides enhancing model parsimony, using summary measures also enabled us to capture the constructs of clinical complexity and frailty, which are more relevant than individual conditions in the context of risk adjustment.
Third, we did not adjust for COPD-specific disease parameters, such as the frequent exacerbator phenotype, chronic hypoxia or chronic hypercapnia. Administrative datasets used for computing hospital-wide quality indicators often lack granular clinical data, which can pose a significant burden for hospitals to systematically collect. The alternative of computing quality indicators from clinical registries may also not be feasible, as clinical registries may not include the whole population of interest, and notably disease parameters may not be systematically collected in routine practice. Moreover, adjusting for disease-specific parameters could obscure quality-of-care differences, because these factors are potentially modifiable through interventions. For example, recurrent exacerbations can be prevented by optimising pharmacotherapy, enrolling into pulmonary rehabilitation and smoking cessation. Moreover, provision of long-term oxygen therapy and domiciliary non-invasive ventilation are evidence-based treatments for chronic hypoxia and chronic hypercapnia, respectively. In other words, clinical factors may represent treatable traits with identifiable and actionable interventions, and may be proxy indicators for process outcomes.
Fourth, a major limitation was lack of data for social risk adjustment—for example, poverty, transport barriers, food insecurity, housing instability and caregiver availability. This reflects broader systemic gaps in capturing the social determinants of health by hospitals and healthcare systems worldwide.33 The optimal social screening tools and domains for risk adjustment remain unclear,33 and some studies have demonstrated that social risk adjustment has minimal impact on readmission rates, potentially serving as a proxy for unmeasured clinical complexity.21 Furthermore, stratifying hospitals by social risk peer groups may obscure disparities in care by limiting comparisons to hospitals serving similarly disadvantaged populations.34 This approach risks overlooking genuine quality-of-care differences that may emerge when comparing hospitals across different social strata. Well-designed studies are needed to determine which social risk factors should be included in risk adjustment and to assess their impact before social risk adjustment can be implemented in Singapore’s healthcare performance metrics.
CONCLUSION
Multimorbidity and frailty were associated with higher odds of 30-day readmission following an index admission for COPD. Risk adjustment revealed significant improvements in performance over time that were not evident in unadjusted analyses. These findings underscore the importance of applying risk adjustments to ensure the validity and fairness of quality metrics.
Supplementary material
Table S1. STROBE statement: Checklist of items that should be included in reports of cohort studies.
References
- Global Initiative for Obstructive Lung Disease. Global strategy for prevention, diagnosis and management of COPD: 2024 report. www.goldcopd.org/2024-gold-report/. Accessed 4 July 2025.
- Safiri S, Carson-Chahhoud K, Noori M, et al. Burden of chronic obstructive pulmonary disease and its attributable risk factors in 204 countries and territories, 1990-2019: results from the Global Burden of Disease Study 2019. BMJ 2022;378:e069679.
- Amegadzie JE, Lee TY, Sadatsafavi M, et al. Trends in hospital admissions for chronic obstructive pulmonary disease over 16 years in Canada. CMAJ 2023;195:E1172-E79.
- Khakban A, Sin DD, FitzGerald JM, et al. The Projected Epidemic of Chronic Obstructive Pulmonary Disease Hospitalizations over the Next 15 Years. A Population-based Perspective. Am J Respir Crit Care Med 2017;195:287-91.
- Shah T, Press VG, Huisingh-Scheetz M, et al. COPD Readmissions: Addressing COPD in the Era of Value-based Health Care. Chest 2016;150:916-26.
- Ruan H, Zhao H, Wang J, et al. All-cause readmission rate and risk factors of 30- and 90-day after discharge in patients with chronic obstructive pulmonary disease: a systematic review and meta-analysis. Ther Adv Respir Dis 2023;17:17534666231202742.
- Australian Commission of Safety and Quality in Health Care. Avoidable Hospital Readmissions: Report on Australian and International Indicators, their Use and the Efficacy of Interventions to Reduce Readmissions. Sydney, NSW: ACSQHC; 2019.
- Krumholz HM, Wang K, Lin Z, et al. Hospital-Readmission Risk — Isolating Hospital Effects from Patient Effects. N Engl J Med 2017;377:1055-64.
- Kristensen SR, Bech M, Quentin W. A roadmap for comparing readmission policies with application to Denmark, England, Germany and the United States. Health Policy 2015;119:264-73.
- Centers for Medicare & Medicaid Services. Hospital Readmissions Reduction Program (HRRP). Updated 10 September 2025. https://www.cms.gov/medicare/payment/prospective-payment-systems/acute-inpatient-pps/hospital-readmissions-reduction-program-hrrp. Accessed 4 July 2025.
- UK Department of Health. Payment by Results Guidance for 2012-13. Published 25 March 2012. https://www.gov.uk/government/publications/confirmation-of-payment-by-results-pbr-arrangements-for-2012-13. Accessed 4 July 2025.
- Pross C, Geissler A, Busse R. Measuring, Reporting, and Rewarding Quality of Care in 5 Nations: 5 Policy Levers to Enhance Hospital Quality Accountability. Milbank Q 2017;95:136-83.
- Goto T, Yoshida K, Faridi MK, et al. Contribution of social factors to readmissions within 30 days after hospitalization for COPD exacerbation. BMC Pulm Med 2020;20:107.
- Nolte E, Roland M, Guthrie S, et al. Preventing Emergency Readmissions to Hospital: A Scoping Review. Rand Health Q 2012;2:10.
- Centers for Medicare & Medicaid Services. Risk Adjustment and Risk Stratification in Quality Measurement, 2013. mmshub.cms.gov/sites/default/files/Risk-Adjustment-in-Quality-Measurement.pdf. Accessed 4 July 2025.
- Ministry of Health, Singapore. Clinical Outcomes Benchmarking and Value Division. Technical Manual for Healthier SG Indicators, 2024. Unpublished report.
- Quan H, Li B, Couris CM, et al. Updating and validating the Charlson comorbidity index and score for risk adjustment in hospital discharge abstracts using data from 6 countries. Am J Epidemiol 2011;173:676-82.
- Gilbert T, Neuburger J, Kraindler J, et al. Development and validation of a Hospital Frailty Risk Score focusing on older people in acute care settings using electronic hospital records: an observational study. Lancet 2018;391:1775-82.
- Bernheim SM, Grady JN, Lin Z, et al. National patterns of risk-standardized mortality and readmission for acute myocardial infarction and heart failure. Update on publicly reported outcomes measures based on the 2010 release. Circ Cardiovasc Qual Outcomes 2010;3:459-67.
- Yale New Haven Health Services Corporation Center for Outcomes Research and Evaluation. 2022 Condition-Specific Readmission Measures Updates and Specifications Report, 2022. Accessed 4 July 2025.
- Cher BAY, Ryan AM, Hoffman GJ, et al. Association of Medicaid Eligibility With Surgical Readmission Among Medicare Beneficiaries. JAMA Netw Open 2020;3:e207426.
- Rhee C, Li Z, Wang R, et al. Impact of Risk Adjustment Using Clinical vs Administrative Data on Hospital Sepsis Mortality Comparisons. Open Forum Infect Dis 2020;7:ofaa213.
- Lin JK, Hong J, Phibbs C, et al. Evaluating the Role of Past Clinical Information on Risk Adjustment. Med Care 2020;58:169-73.
- Lin P, Shen C, Li Q, et al. A systematic review and meta-analysis of chronic obstructive pulmonary disease in asia: risk factors for readmission and readmission rate. BMC Pulm Med 2024;24:388.
- George PP, Heng BH, Lim TK, et al. Evaluation of a disease management program for COPD using propensity matched control group. J Thorac Dis 2016;8:1661-71.
- Ruan H, Zhao H, Wang J, et al. All-cause readmission rate and risk factors of 30- and 90-day after discharge in patients with chronic obstructive pulmonary disease: a systematic review and meta-analysis. Ther Adv Respir Dis 2023;17:17534666231202742.
- Erlich MD, Runnels P, Talley R. Clinician Responsibility in Value-Based Payment Systems. Psychiatr Serv 2022;73:693.
- Mukhopadhyay A, Mohankumar B, Chong LS, et al. Factors and experiences associated with unscheduled 30-day hospital readmission: A mixed method study. Ann Acad Med Singap 2021;50:751-64.
- Triche EW, Xin X, Stackland S, et al. Incorporating Present-on-Admission Indicators in Medicare Claims to Inform Hospital Quality Measure Risk Adjustment Models. JAMA Netw Open 2021;4:e218512.
- Ibrahim AM, Dimick JB, Sinha SS, et al. Association of Coded Severity With Readmission Reduction After the Hospital Readmissions Reduction Program. JAMA Intern Med 2018;178:290-2.
- So JY, O’Hara NN, Kenaa B, et al. Population Decline in COPD Admissions During the COVID-19 Pandemic Associated with Lower Burden of Community Respiratory Viral Infections. Am J Med 2021;134:1252-9.
- Joynt Maddox KE, Reidhead M, Hu J, et al. Adjusting for social risk factors impacts performance and penalties in the hospital readmissions reduction program. Health Serv Res 2019;54:327-36.
- Press VG, Tang JW. Social Risk Screening Is Increasing, but Is Screening Enough? JAMA Netw Open 2025;8:e2453128.
- Tran LD. Social Risk Adjustment in Health Care Performance Measures. JAMA Netw Open 2020;3:e208020.
This study was approved by SingHealth Centralised Institutional Review Board (2018/2698).
All the authors have no affiliations or financial involvement with any commercial organisation with a direct financial interest in the subject or materials discussed in the manuscript.
Dr Anthony Yii, Department of Respiratory and Critical Care Medicine, Changi General Hospital, 2 Simei St 3, Singapore 529889. Email: [email protected]
