


Dear Editor,
Access to statistical and graphical tools is fundamental to all clinical research for data analysis.1 However, subscription-based models and complex functionality of existing statistical software that require formal training are barriers to access, specifically for junior clinicians and healthcare professionals, including early-career researchers and healthcare professionals from low- to middle-income countries.1-4 Although Microsoft Excel is used, it can be prone to errors due to autoformatting and difficulty in performing analysis on large datasets.5,6 While open-source statistical programmes like Jamovi and BlueSky Statistics have become available, they do not provide data visualisation, creating a gap in this area for healthcare professionals.1,7
The authors aimed to develop a user-friendly, publicly available web-based data analysis tool with statistical and data visualisation functions called STAT, which can enhance the confidence of healthcare professionals in clinical data analysis.
The STAT webtool was created using the Streamlit (https://www.streamlit.io) platform. An interactive and user-friendly version of the tool is publicly available at https://statapp.streamlit.app/. STAT was coded using Python 3.7, utilising the latest version of statistical packages SciPy, Researchpy, scikit-learn and scikit_posthocs, and data visualisation packages Chart Studio, Matplotlib, seaborn and SigFig. The concept of STAT spurred from the fact that healthcare professionals engaged in clinical research frequently need to undertake certain statistical analyses and data visualisation. Yet, the existing resources do not sufficiently support this need. Accordingly, (1) statistical tools based on descriptive statistical measures and measures of association most commonly used to analyse healthcare data, and (2) common data visualisation tools that were not provided in the current freely available statistical software (Supplementary Appendix S1) were selected.7,8 STAT is also optimised for structured, tabular datasets, relying on the most familiar, standard format (Supplementary Appendix S1). The codes, files and instructions on running STAT have been uploaded to a GitHub repository (https://github.com/kuanrongchan/STAT).
To assess the user experience and their confidence in clinical data analysis using STAT, the participants were recruited as below. The webtool was made freely available at https://statapp.streamlit.app/ and publicised in the medical and research community of National University Health System (NUHS) via email and social media, inviting them to attend the workshop to learn the STAT tool (Fig. 1A); the target audience included doctors, allied health professionals such as nurses and research staff. NUHS is a tertiary healthcare institution closely affiliated with the National University of Singapore (NUS). The training session was recorded and is made freely available on YouTube (https://youtu.be/k2GU7M3xxKE). The study was approved by the NUS Institutional Review Board (NUS-IRB-2023-554). Detailed methodology is provided in Supplementary Appendix S1.
A total of 95 participants, aged 22–63 years, participated and filled in both pre- and post-learning questionnaires. Only 10% of participants had non-clinical qualifications, and the majority of participants did not have experience using data analysis software other than Microsoft Excel (Supplementary Table S1).
After the practice data analysis, the majority (71.6%, n=68) found the STAT webtool was easy to use (Fig. 1B) and they would recommend it to others for clinical data analysis (98.9%, n=94) (Fig. 1C). Comparing pre- and post-workshop user confidence levels for clinical data analysis, the STAT webtool workshop significantly improved user confidence (P<0.0001) (Fig. 1D).
The authors also intended to understand whether prior knowledge of data analysis programmes or profession affected the outcomes. Hence, a comparison of participants with and without prior knowledge of data analysis programmes other than Microsoft Excel (n=52 and n=34, respectively) was performed. Also compared were the experience of doctors (n=35) versus allied health professionals (n=51).
As expected, those with knowledge of programmes other than Excel had greater confidence before being introduced to STAT. However, participants had a significant improvement in confidence regardless of whether they had knowledge of programmes other than Excel (Fig. 1E). Profession had no bearing on pre- and post-training confidence in clinical data analysis; doctors and allied health professionals both had a significant improvement in confidence (Fig. 1F).
Fig. 1. Workflow of the STAT webtool workshop and participants’ post-workshop feedback.
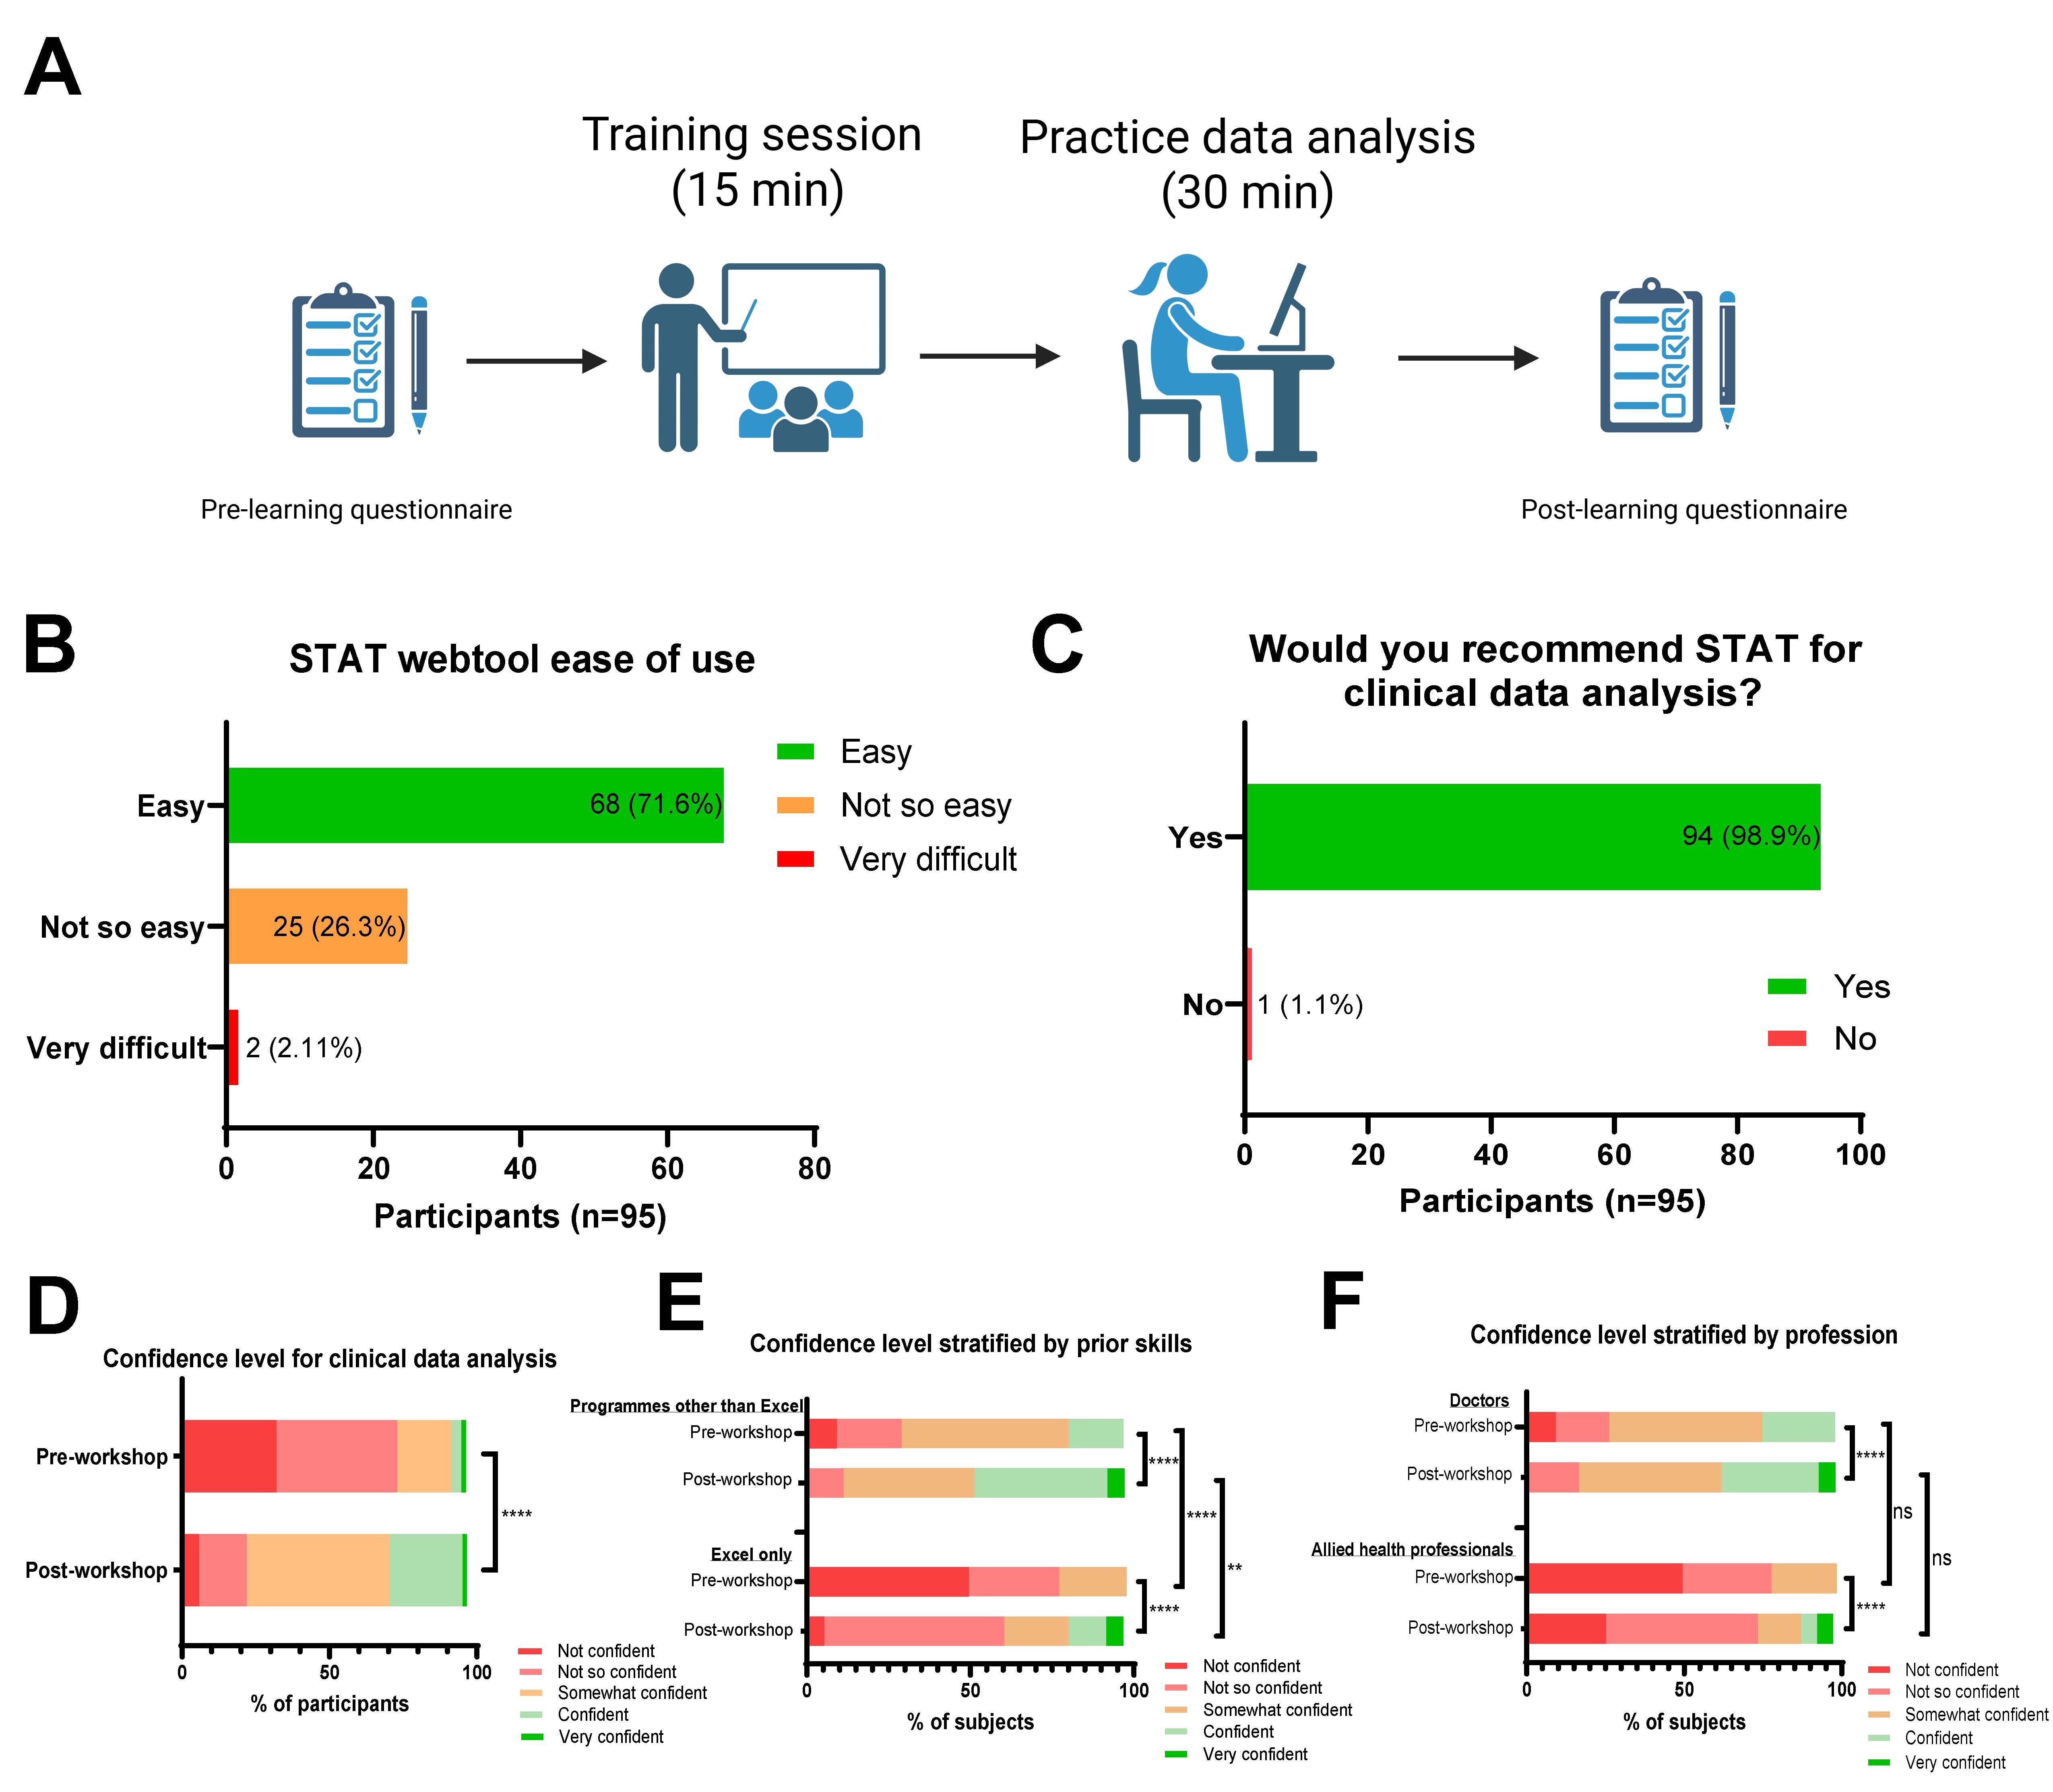
(A) STAT Webtool workshop activity flow. Created in https://BioRender.com. (B) Participants’ feedback recorded post-workshop for STAT’s ease of use. (C) Participants’ feedback recorded post-workshop on whether they would recommend STAT for clinical data analysis. (D) Confidence level of participants (n=97) performing clinical data analysis increased after the workshop (P<0.0001), compared to before the workshop. (E) Confidence levels for clinical data analysis before and after the workshop, stratified by prior skills (those who used programmes other than Microsoft Excel and those who only used Microsoft Excel). (F) Confidence levels for clinical data analysis before and after the workshop, stratified by profession (doctors and allied health professionals).
Most of the participants evaluated in our study indicated that the tool was easy to use, with improved confidence in data analysis using STAT. The 10-minute accompanying YouTube tutorial that mimics the training session in our study, has capability to facilitate learning for prospective users at their own pace, without the need for formal training. Compared to other open-source solutions—such as Jeffreys’s Amazing Statistics Program, BlueSky Statistics software and Statistics Open for All—our webtool is maintained online and does not require local installation to deploy. This is one of the key advantages since it means it can be whitelisted for use on hospital computers. Healthcare institutions usually have strict data security policies to ensure that patient data do not leave internal servers. Such requirements typically preclude the possibility of programme installation by users that are not pre-approved by the in-house IT team.7 Alternatively, there is also flexibility of local installation that allows it to be run without internet access. Finally, it is capable of handling large datasets, as it is executed through the Python programming language.
In the knowledge-to-action cycle of continual improvement in healthcare, knowledge is first created through robust research conducted on clinical datasets; this could be in the form of observational studies such as cohort studies, or interventional studies such as randomised controlled trials.9 Thereafter, evidence is implemented and then outcomes evaluated; this is often done in the form of implementation studies and clinical audits. Robust analysis and clear visualisation of clinical data underlie all the steps in this cycle. Unlike R, IBM SPSS or STATA, which require advanced expertise in data analysis or subscription, STAT improves access to data analytics for busy healthcare professionals. In fact, being agnostic to actual context of the input dataset, STAT has broad applicability across different industries where simple and efficient data analysis needs to be performed by non-analysts.
The age distribution of our study participants, between 26.3 and 36.4 years, may limit the extrapolation of findings to researchers outside of this range. However, this limitation may not affect our overarching goal of improving confidence in data analysis for early-career healthcare professionals.
In conclusion, the STAT tool developed in the study has potential to empower healthcare professionals to perform clinical data analysis, visualisation and statistical comparisons.
Supplementary materials
Appendix S1. Methods.
Appendix S2. User feedback questionnaire.
Table S1. STAT study participant (n=95) demographics, profession, non-clinical qualifications and prior experiences with statistical applications.
Table S2. Complete the following descriptive table.
Table S3. Test for correlations between age, baseline SBP and post-treatment SBP, stratified by smoking status.
Table S4. Discover univariate predictors for clinically significant decrease in SBP (i.e. more than 5 mmHg).
Table S5. Dataset used for the hands-on activity. Information about 250 participants, their blood pressure before and after treatment, and subject demographics.
Fig. S1. STATApp flowchart of analysis that could be done after data have been imported.
Acknowledgement
The authors want to thank Dr Chan Yiong Huak for his guidance on statistical tests selected for inclusion in STAT. They also want to thank Dr Dimple Rajgor for her assistance in editing, formatting, reviewing and in submitting the manuscript for publication.
REFERENCES
- MacDougall M, Cameron HS, Maxwell SRJ. Medical graduate views on statistical learning needs for clinical practice: a comprehensive survey. BMC Med Educ 2019;20:1.
- Liang Z, Ba Z, Mao J, et al. Research complexity increases with scientists’ academic age: Evidence from library and information science. J Informetr 2023;17:101375.
- Ranieri V, Barratt H, Fulop N, et al. Factors that influence career progression among postdoctoral clinical academics: a scoping review of the literature. BMJ Open 2016;6:e013523.
- Masuadi E, Mohamud M, Almutairi M, et al. Trends in the Usage of Statistical Software and Their Associated Study Designs in Health Sciences Research: A Bibliometric Analysis. Cureus 2021;13:e12639.
- Koh CWT, Ooi JSG, Joly GLC, et al. Gene Updater: a web tool that autocorrects and updates for Excel misidentified gene names. Sci Rep 2022;12:12743.
- Panko R. What We Know About Spreadsheet Errors. J Organ End User Comput 2005;10.
- Ashour L. A review of user-friendly freely-available statistical analysis software for medical researchers and biostatisticians. Res Stat 2024;2:2322630.
- Krousel-Wood MA, Chambers RB, Muntner P. Clinicians’ guide to statistics for medical practice and research: part I. Ochsner J 2006;6:68-83.
- Graham ID, Logan J, Harrison MB, et al. Lost in knowledge translation: time for a map? J Contin Educ Health Prof 2006;26:13-24.
This study was approved by the NUS Institutional Review Board (NUS-IRB-2023-554) on 18 August 2023 and conducted in accordance with the Declaration of Helsinki.
The authors declare they have no affiliations or financial involvement with any commercial organisation with a direct financial interest in the subject or materials discussed in the manuscript.
Dr Zhong Youjia, Department of Paediatrics, Yong Loo Lin School of Medicine, National University of Singapore, 1E Kent Ridge Road NUHS Tower Block, Level 12, Singapore 119228. Email: [email protected]
