

ABSTRACT
Introduction: Despite rising healthcare expenditure in Singapore, detailed utilisation patterns are not well characterised. We analyse utilisation within SingHealth, the country’s largest public healthcare cluster.
Methods: We conducted a retrospective observational study using patient-level data from 2019 to 2024, across inpatient, outpatient specialist, and primary care settings. Patients were categorised using the Modified British Columbia (ModBC) Population Segmentation Framework, and inpatient diagnoses were classified using a locally adapted version of the Clinical Classifications Software Refined (CCSR). Healthcare costs were reported in inflation-adjusted 2024 Singapore dollars (SGD). Descriptive statistics and temporal trend analyses were performed.
Results: The patient population increased from 1.21 million in 2019 to 1.37 million in 2024, while total healthcare expenditure rose from SGD 4.37 billion to SGD 6.05 billion. Inpatient care remained the dominant cost driver, accounting for 63.8% of total expenditure in 2024, with a stable relative share over time. Expenditure increased disproportionately among older adults, with the steepest per-user growth in those aged ≥80 years, consistent with age-related acceleration in healthcare spending. Absolute utilisation increased among adults aged ≥60 years, while utilisation rates within age groups remained stable, suggesting that growth was associated with changes in population composition rather than utilisation intensity. Patients in the ModBC high-complex chronic conditions and cancer segments accounted for 46.7% of total expenditure. Diagnosis-level analyses using CCSR revealed age-related differences in utilisation patterns within these segments.
Conclusion: Rising healthcare expenditure appears consistent with population ageing and the increasing complexity of chronic diseases. Addressing these challenges will require a sustained shift towards preventive, community-based, and value-driven models of care to ensure long-term system sustainability.
CLINICAL IMPACT
What is New
- This is the first comprehensive, patient-level, longitudinal analysis of healthcare utilisation and costs across the full continuum of care in SingHealth, Singapore’s largest public healthcare cluster.
- The findings support a pathway in which population ageing and secular advances in medical care increase the number of clinically complex patients, thereby driving healthcare utilisation and expenditure.
Clinical Implications
- Addressing the rising healthcare expenditure will require a sustained shift towards preventive, community-based, and value-driven models of care to ensure long-term system sustainability.
Healthcare utilisation and expenditure have risen globally, placing increasing strain on the health systemClick or tap here to enter text..1 Global health spending reached approximately United States Dollars (USD) 9.8 trillion (9.9% of global gross domestic product [GDP]) in 2022,1 while OECD health expenditure increased from 8.8% of GDP in 2019 to 9.2% in 2023.2 These trends are driven by population ageing, rising non-communicable disease burden, emerging health risks, and advances in medical technology, underscoring the need for sustainable health system reforms.1,2
Singapore’s healthcare system, often regarded as cost-effective, is not immune to these pressures. It achieves universal health coverage through its “3M” framework—MediShield Life, MediSave, and MediFund—which combines mandatory medical savings, subsidised insurance, and a public safety net.3,4 This approach has supported strong health outcomes, while maintaining relatively low national health expenditure (4–5% of GDP).5 However, healthcare expenditures have risen in both absolute and relative terms. Government health expenditure increased from Singapore dollars (SGD) 3.9 billion (2.0% of GDP) in 2010 to SGD 11.1 billion (2.2%) in 2019, exceeding SGD 15 billion (>2.9% of GDP) in both 2020 and 2021 during the COVID-19 pandemic,6 and is projected to rise from SGD 21 billion in 2025 to SGD 30 billion by 2030.
In response, the Healthier SG initiative was launched in 2023 to strengthen preventive health and chronic disease management. It promotes longitudinal primary care, public–private collaboration, and a shift towards capitation-based financing to support preventive care and population-level health management across Singapore’s 3 healthcare clusters—Singapore Health Services (SingHealth), National University Health System, and National Healthcare Group (NHG) Health.7
Despite well-documented national trends, the granular patterns of healthcare utilisation across care settings remain less well understood. Such insights are critical for identifying utilisation trajectories, evolving care needs, and service gaps, and for informing value-based care strategies. This study examines healthcare utilisation within SingHealth, Singapore’s largest healthcare cluster, comprising 4 acute hospitals, 5 national specialty centres, 3 community hospitals, and 10 primary care polyclinics, serving nearly half of the population. Specifically, we examine how demographic change and clinical complexity, as characterised by a population segmentation framework, relate to patterns of healthcare utilisation and expenditure across care settings. Using longitudinal data from 2019 to 2024 across inpatient, outpatient specialist, and primary care services, and leveraging diagnosis-level analyses using the Clinical Classifications Software Refined (CCSR) to characterise inpatient utilisation patterns, this study aims to inform resource planning and support the development of targeted strategies to ensure the sustainability of Singapore’s largest healthcare delivery system.
METHODS
Study setting and data sources
This was a retrospective, population-based observational study of all individuals with at least 1 healthcare encounter within SingHealth between 2019 and 2024. Patient-level data were obtained from the SingHealth Integrated Electronic Health Records database, which consolidates administrative, clinical, and billing information across all SingHealth institutions and care settings.
Inclusion and exclusion criteria
The study included all individuals with at least 1 recorded healthcare encounter at any SingHealth institution between 1 January 2019 and 31 December 2024. The study population therefore comprises patients who utilised SingHealth services and does not represent the resident population of any defined catchment area. The cohort spanned all age groups, sexes, and major ethnic groups. Complete case analysis was conducted, with no exclusion criteria applied.
Variables and measures
Demographic variables included sex, ethnicity, and age, categorised into 7 groups: 0–4 years, 5–17 years, 18–39 years, 40–59 years, 60–69 years, 70–79 years, and 80 years or older—reflecting meaningful life stages and healthcare utilisation patterns across the lifespan.
Healthcare costs were captured comprehensively across 3 main care settings. Inpatient costs included all expenses associated with hospital admissions, such as room charges, procedures, medications, and professional fees. Outpatient costs comprised expenditures for specialist clinic visits and ambulatory services, while primary care costs covered public sector primary care services within SingHealth (i.e., polyclinic visits) and did not include private general practitioner services. Total healthcare costs were calculated as the sum of expenditures across all 3 settings for each calendar year, providing a complete picture of healthcare resource utilisation.
Modified British Columbia Population Segmentation Framework
The Modified British Columbia Population Segmentation Framework (ModBC), adapted from the British Columbia Health System Matrix, was used to stratify a heterogeneous population into mutually exclusive subgroups based on healthcare needs and complexity,8,9 enabling utilisation trends to be interpreted in relation to underlying care needs. The framework uses a hierarchical classification algorithm that assigns individuals to segments based on their most significant healthcare need, ensuring that patients with multiple conditions are classified by their highest level of complexity. Within these segments, we examined demand-driving utilisation patterns to inform targeted, needs-based interventions and service planning.
In this study, patients were classified into 7 ModBC categories (detailed in Supplementary Table S1):
- Healthy with outpatient utilisation;
- Healthy with inpatient admission;
- Low-complex chronic conditions;
- Medium-complex chronic conditions;
- Mental health conditions;
- High-complex chronic conditions; and
- Cancer
These analytic categories were consolidated from the original 12 ModBC segments to improve interpretability. They are intended for population health planning and should not be interpreted as a linear hierarchy of disease severity, but rather as reflecting distinct patterns of healthcare needs and utilisation. For example, the mental health segment is defined using prespecified diagnosis and procedure codes within the adapted ModBC algorithm, rather than symptom scores or screening instruments, while the cancer segment is defined using cancer-related coding rules, including malignant and metastatic disease where applicable, and is analysed separately because of its distinct care pathways and resource requirements.
The classification algorithm draws on healthcare data from the current year and the preceding 4 years to account for each patient’s chronic disease complexity. Patients may transition between segments over time as their clinical status evolves. Diagnostic information was drawn from all healthcare encounters, including primary care diagnoses, primary and secondary ICD-10 codes, and surgical procedure codes. As part of the internal assignment logic of the ModBC algorithm, patients without chronic disease complexity tags were further stratified based on their healthcare utilisation intensity (as measured by emergency visits, hospitalisations, and specialist consultations) for the current year of assessment; this stratification was used solely for segment assignment and was not independently reported in the results section.
Clinical Classifications Software Refined
To enable clinically meaningful analysis of inpatient utilisation patterns, primary inpatient diagnoses were classified using a locally adapted version of the Clinical Classifications Software Refined (CCSR), originally developed by the US Agency for Healthcare Research and Quality.11 While ICD-10 codes provide granular diagnostic detail, their high dimensionality and clinical specificity can limit interpretability for population-level analyses. The CCSR addresses this by grouping ICD-10 Clinical Modification (ICD-10-CM) codes into approximately 530 clinically meaningful categories providing insights into disease-specific healthcare utilisation and outcomes.10,11 As Singapore uses the ICD-10 Australian Modification (ICD-10-AM), a customised mapping algorithm was used to align ICD-10-AM codes to CCSR categories.12
Cost and statistical analysis
Healthcare costs were defined as gross bill charges before government subsidies, insurance disbursements, or patient co-payments, and therefore reflect the provider’s perspective. Costs were expressed in 2024 SGD and adjusted for inflation using the Singapore Consumer Price Index. This enabled year-on-year comparisons while accounting for changes in purchasing power over the study period. Descriptive statistics summarised population characteristics and healthcare costs. Trends from 2019 to 2024 were examined by care setting, demographic subgroup, and ModBC category. Analyses were conducted in R version 4.4.1 (R Foundation for Statistical Computing, Vienna, Austria).
Ethics
Ethics approval was obtained from the SingHealth Centralised Institutional Review Board (CIRB) prior to initiating this study (SingHealth CIRB reference number: 2022/00892). As all participant data were de-identified, a waiver for participant consent was also obtained.
RESULTS
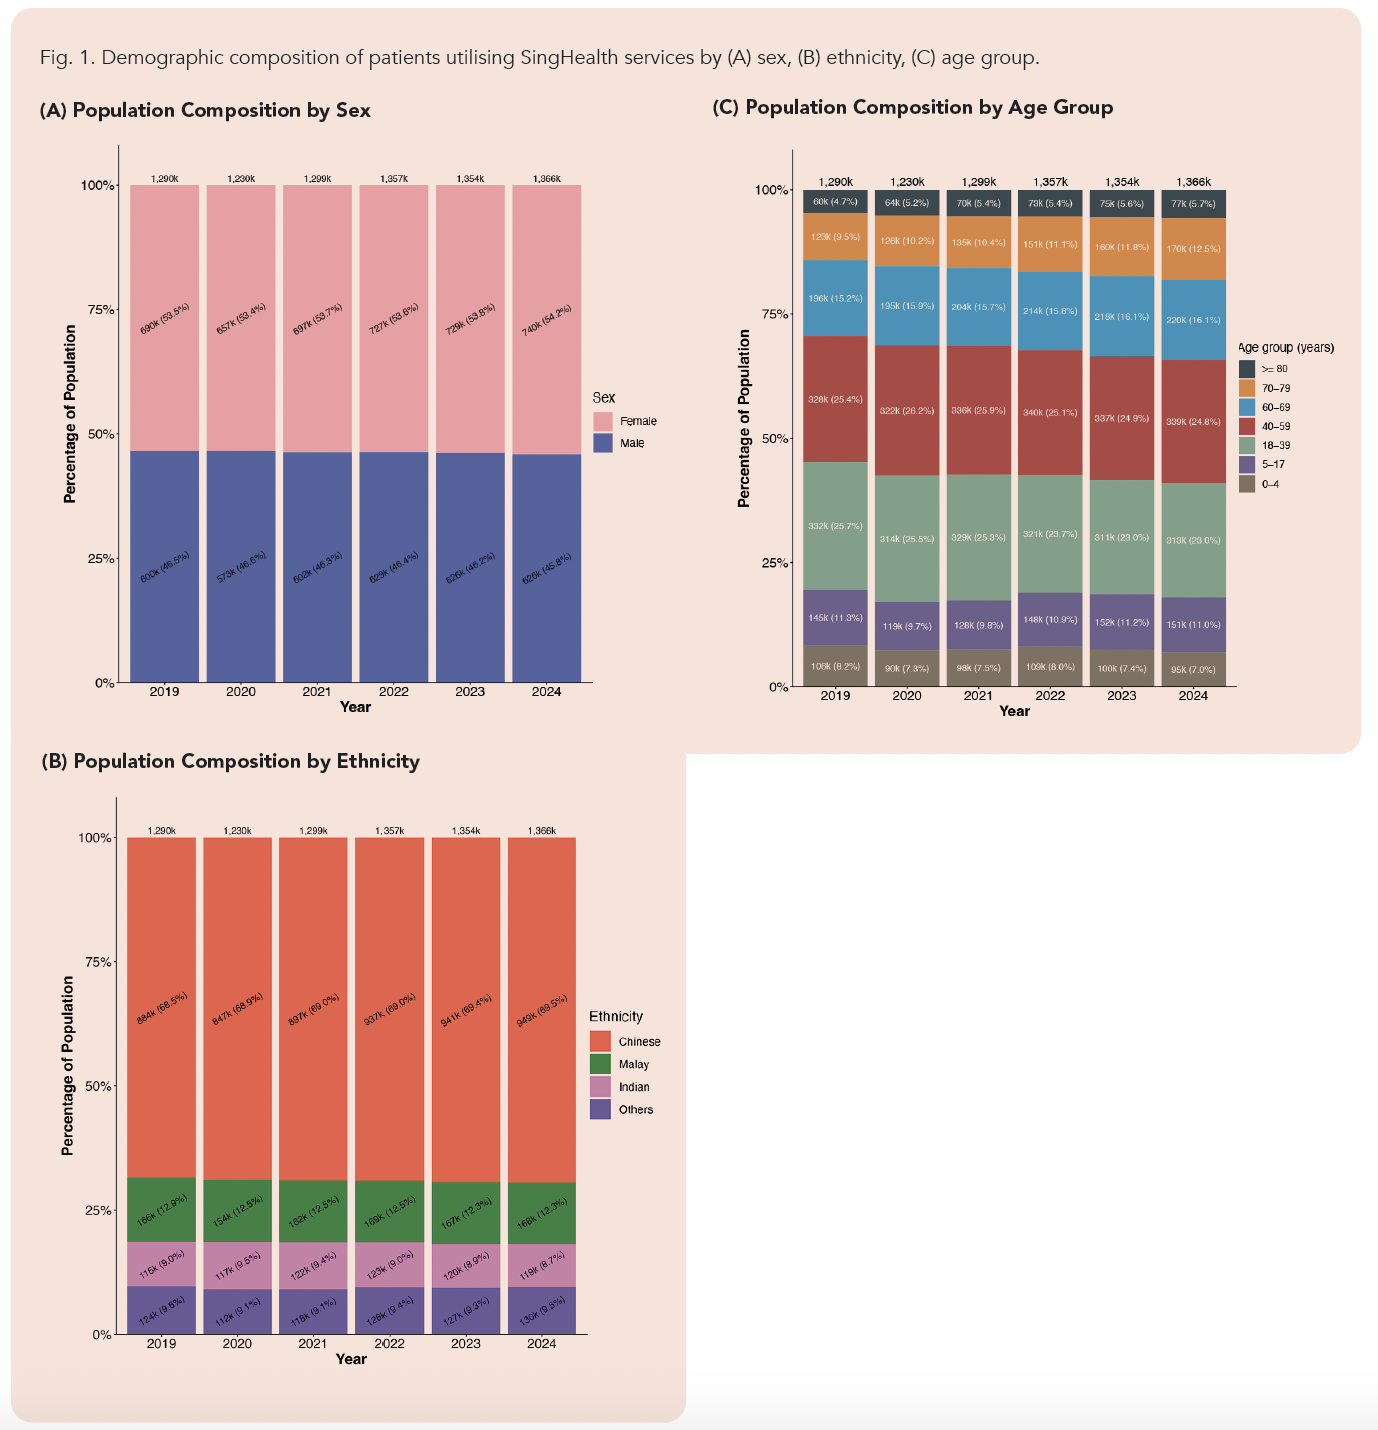
Across the study period, the number of patients served by SingHealth increased from 1.21 million in 2019 to 1.37 million in 2024 (Fig. 1A). The proportion of female patients remained relatively stable (53.4–54.2%), and the ethnic distribution closely mirrored that of the national population (Fig. 1B). 14 The population of Chinese patients exhibited modestly higher growth (Supplementary Fig. S1). The patient cohort became progressively older over time, with patients aged ≥60 years increasing from 379,275 (29.4%) in 2019 to 467,186 (34.2%) in 2024 (Fig. 1C and Supplementary Fig. S2).
Fig. 1. Demographic composition of patients utilising SingHealth services by (A) sex, (B) ethnicity, (C) age group.
Total inflation-adjusted healthcare expenditure increased steadily over the study period, rising from SGD 4.37 billion in 2019 to SGD 6.05 billion in 2024 (Fig. 2A). Inpatient care remained the largest cost component, accounting for 63.8% of total expenditure in 2024, with a stable share over time (63.2% in 2019 to 63.8% in 2024), indicating growth in absolute but not relative terms.
Fig. 2. Distribution of healthcare expenditure (in SGD millions) by type of care and demographic characteristics by (A) sex, (B) ethnicity, (C) age group.
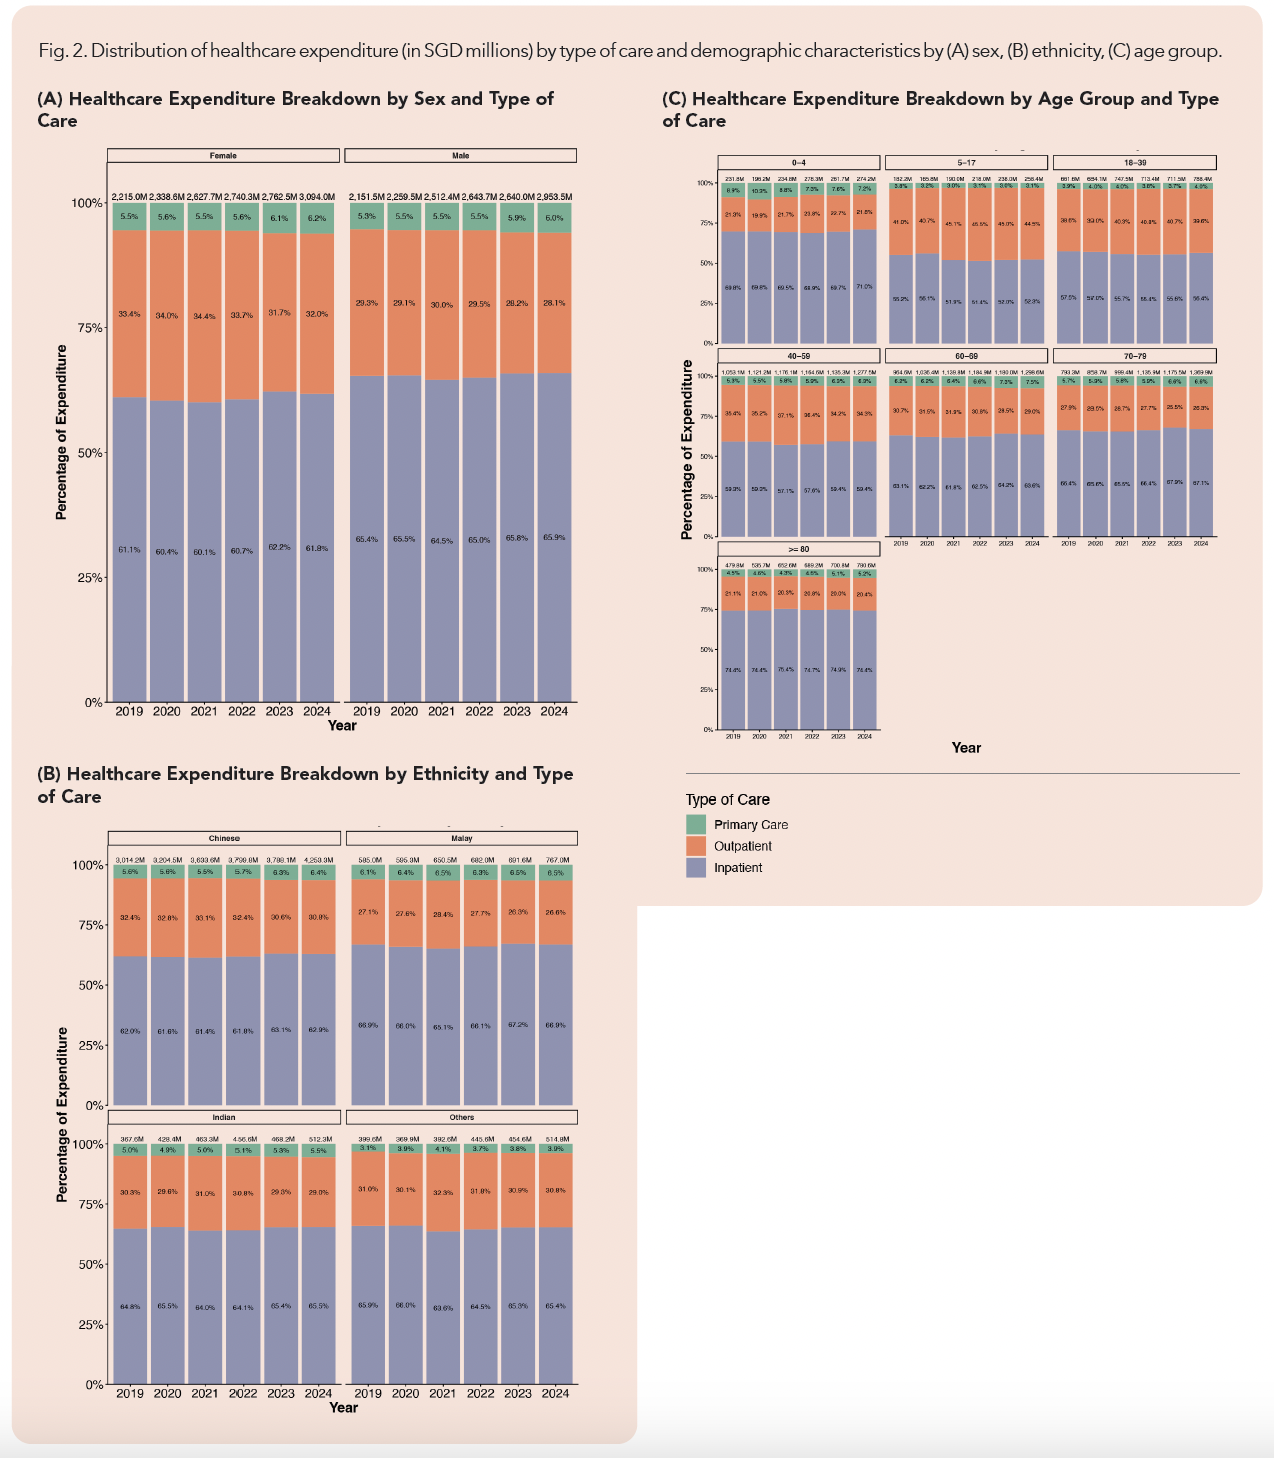
In 2024, females accounted for slightly higher total expenditure than males (SGD 2.22 billion versus SGD 2.15 billion, respectively). On aggregate, males had a higher proportion of their total spending attributed to inpatient care and a lower proportion to outpatient services (Fig. 2A). Across ethnic groups, the distribution of healthcare expenditure by type of care remained broadly stable over time (Fig. 2B). However, Chinese patients exhibited the largest overall increase in healthcare expenditure, with consistently higher growth across most care settings compared with other ethnic groups (Supplementary Fig. S3). Similarly, across age groups, the distribution of healthcare expenditure by type of care remained broadly stable over time (Fig. 2C). However, older patients aged 70–79 years and ≥80 years exhibited the largest overall increases in healthcare expenditure, with consistently higher growth across all care settings (Supplementary Fig. S4).
Fig. 3. Service utilisation trends by age group and type of care (A) absolute utilisation, (B) utilisation rates.
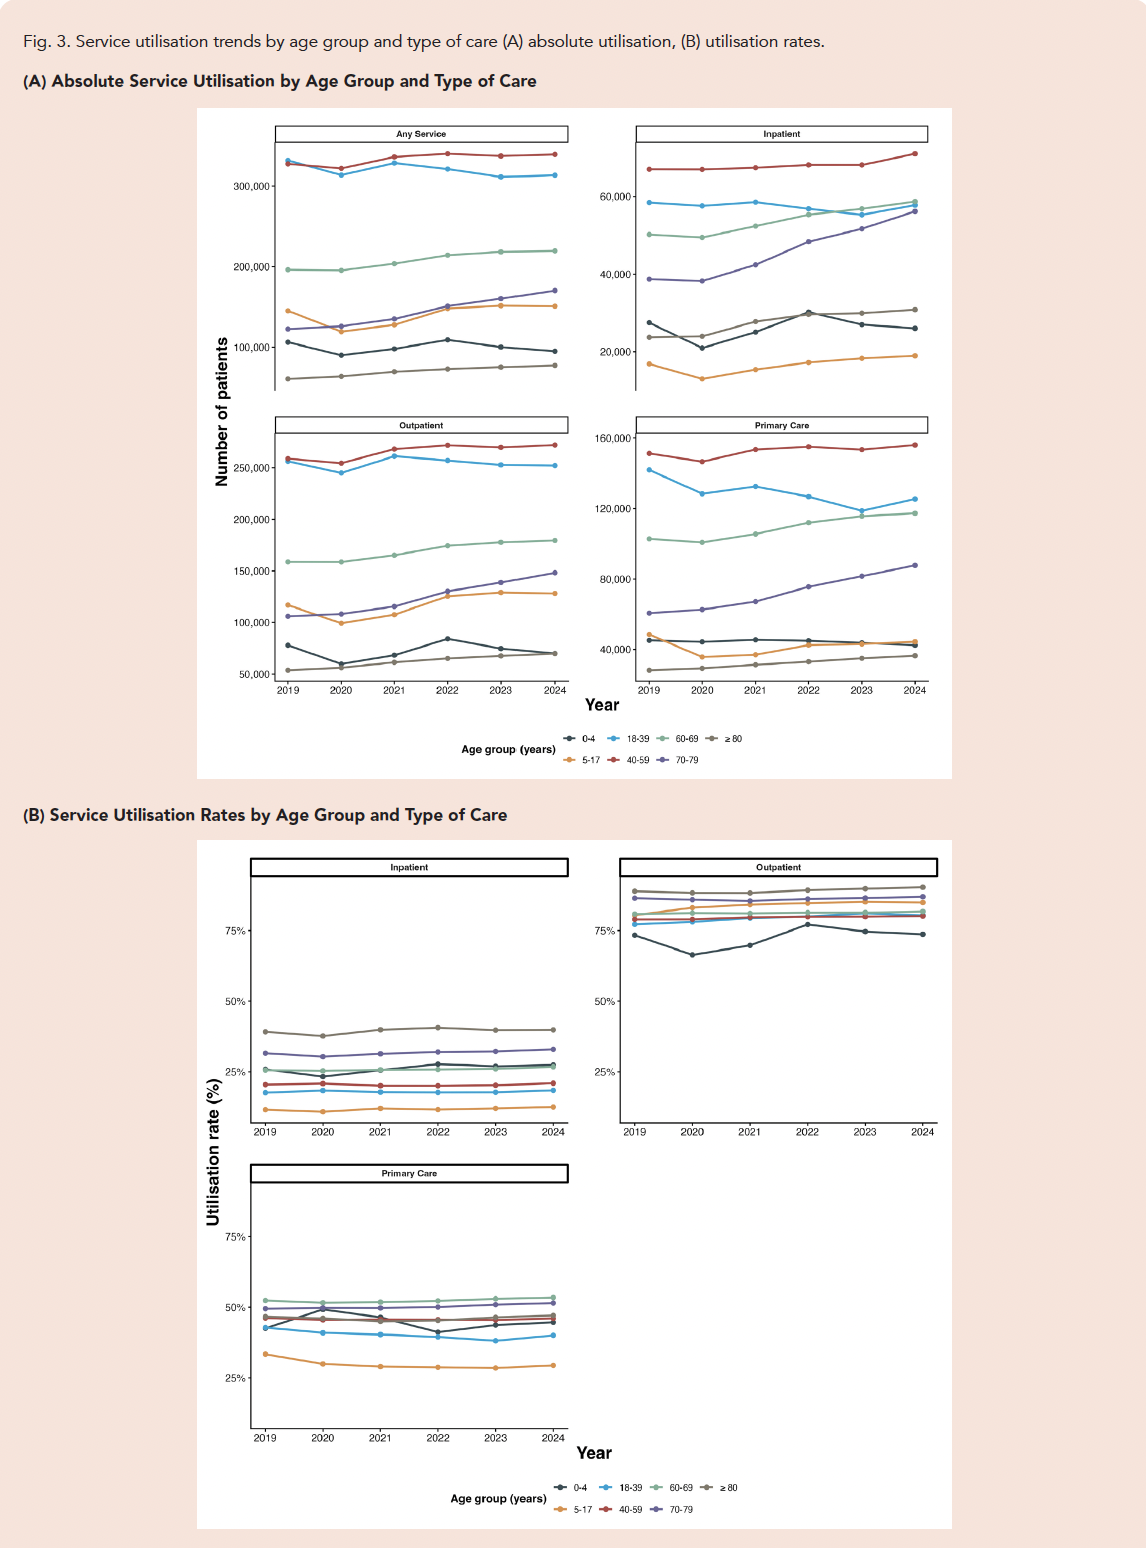
Absolute utilisation of inpatient, outpatient, and primary care services (defined as the number of patients utilising each service) increased over time for patients aged ≥60 years and especially for those aged 70–79 years (Fig. 3A, Supplementary Fig. S5). In contrast, service-specific utilisation rates within age groups (defined as the number of patients utilising a given service divided by the number of patients in that age group utilising any service) remained relatively stable across most services (Fig. 3B). These findings are consistent with rising service use being associated more with shifts in population composition (Fig. 1C) than with increased utilisation intensity within age groups.
Fig. 4. Per-user healthcare expenditure by type of care and demographic characteristics by (A) sex, (B) ethnicity, (C) age group.
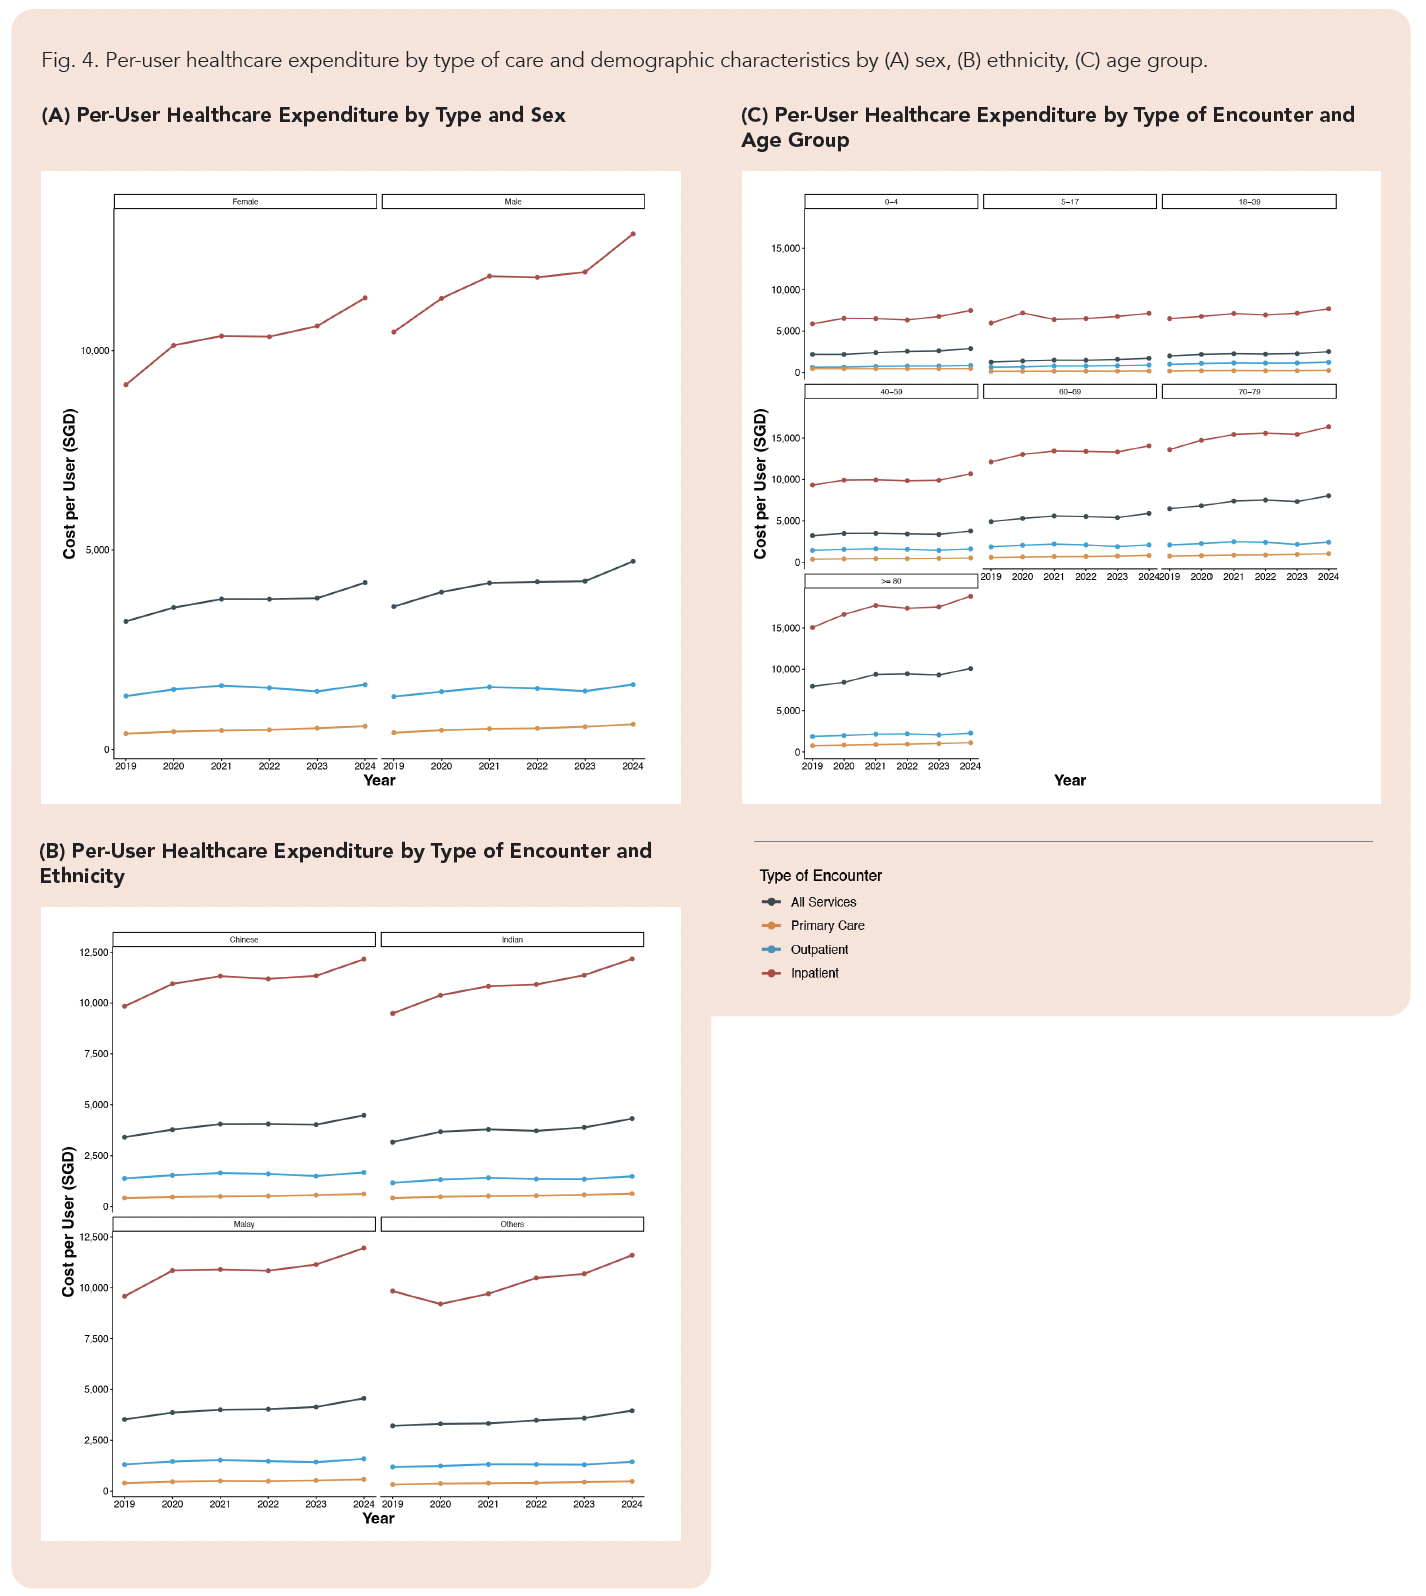
Inpatient care had the highest per-user expenditure (calculated as the total service expenditure divided by the number of patients who utilised the service in a given year), followed by outpatient and then primary care (Fig. 4). Inpatient per-user expenditure was higher in males than in females, showed minimal variation across ethnic groups, and increased with age, particularly among individuals aged ≥60 years. Notably, inpatient per-user expenditure increased over time, with the greatest growth observed in older age groups (Fig. 4C and Supplementary Table S3). In contrast, per-user expenditure for outpatient and primary care remained relatively consistent across age groups and did not exhibit substantial increases over time.
Fig. 5. (A) Population composition by ModBC segment, (B) total healthcare expenditure by ModBC segment, (C) per-user cost by ModBC segment.
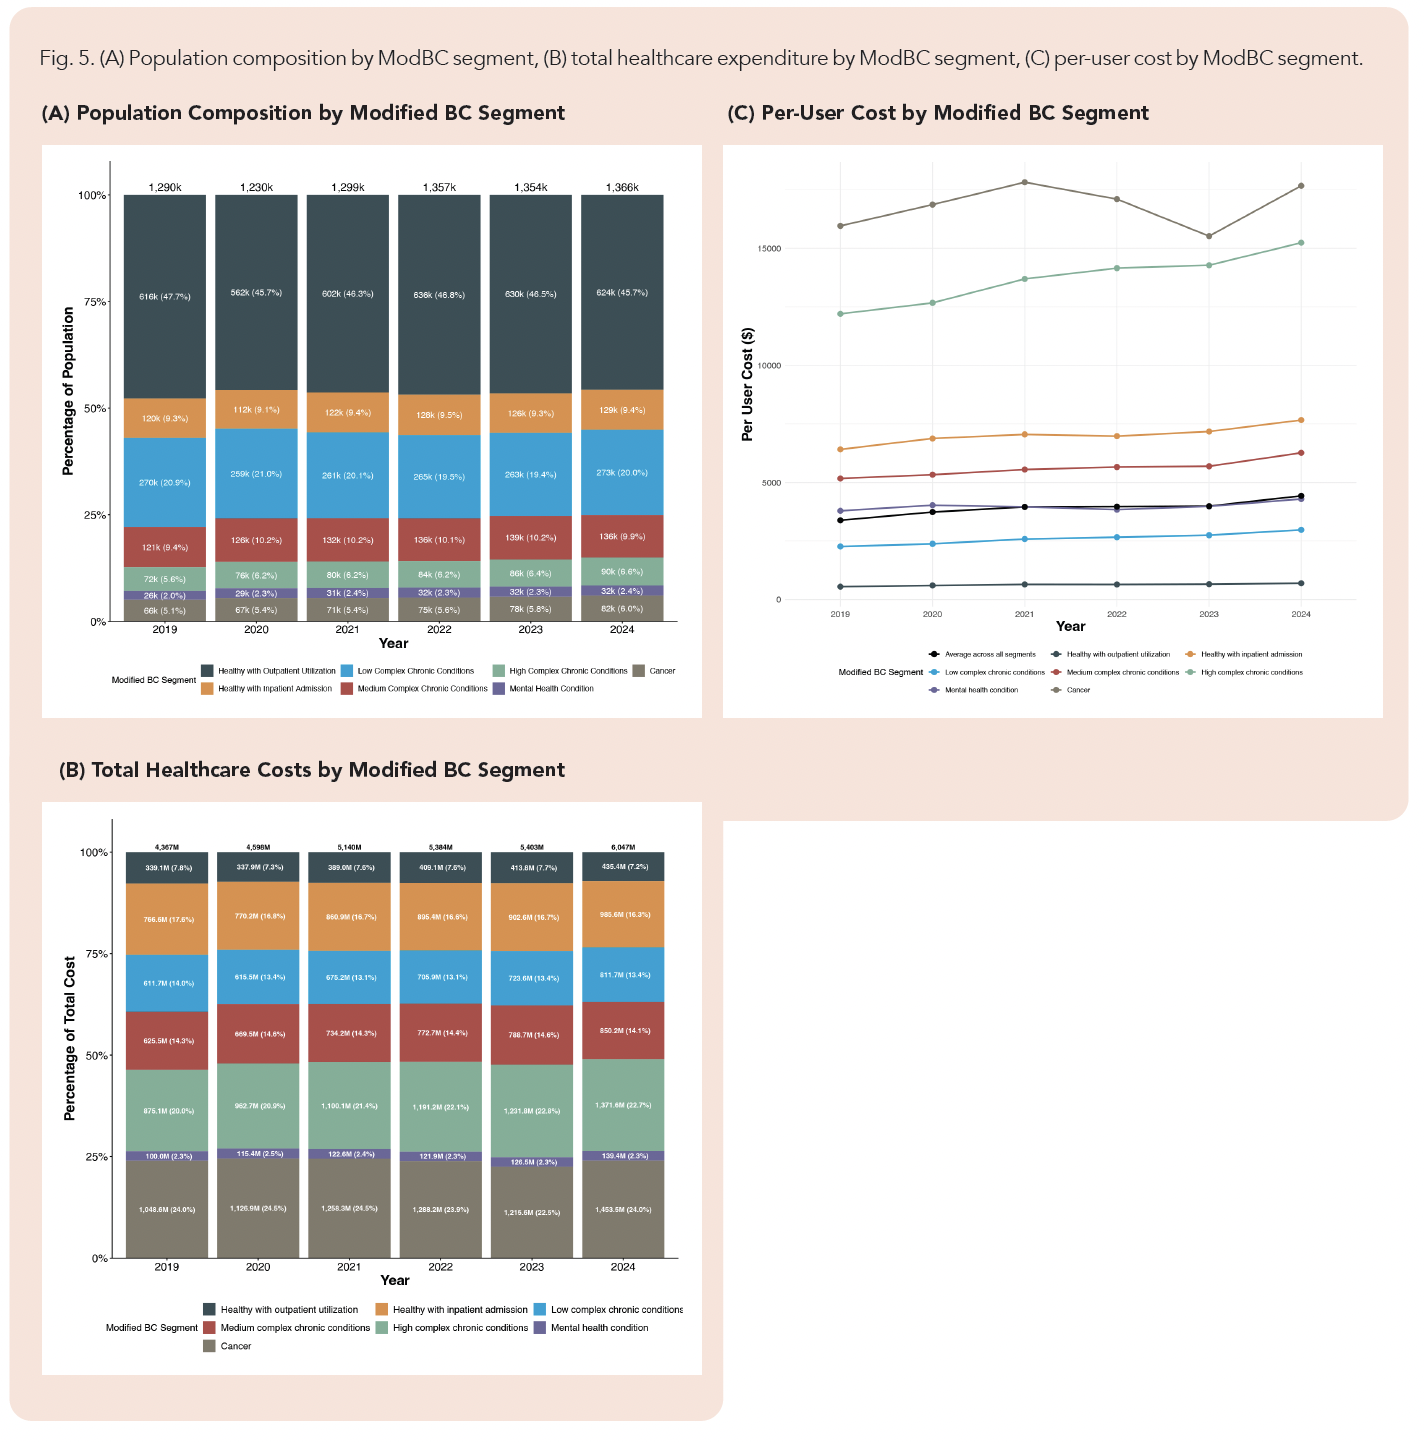
The distribution of patients by ModBC segment (Fig. 5A) showed increasing absolute counts and modest proportional growth in the high-complex chronic conditions and cancer segments over the study period, consistent with a shift towards higher clinical complexity. In 2024, patients in the cancer segment accounted for 24.0% of healthcare expenditure, followed by patients with high-complexity chronic conditions (22.7%) and patients in the healthy with inpatient admission segment (16.3%) (Fig. 5B). Despite differences in total expenditure, patients in the cancer and high-complex chronic conditions segments incurred substantially higher per-user costs, calculated as total expenditure within a segment divided by the number of patients in that segment in a given year (Fig. 5C). Interestingly, healthy patients with inpatient admissions had higher per-user costs than patients in the medium- and low-complexity chronic conditions segment.
Distribution of top hospital admission diagnoses by patient segment
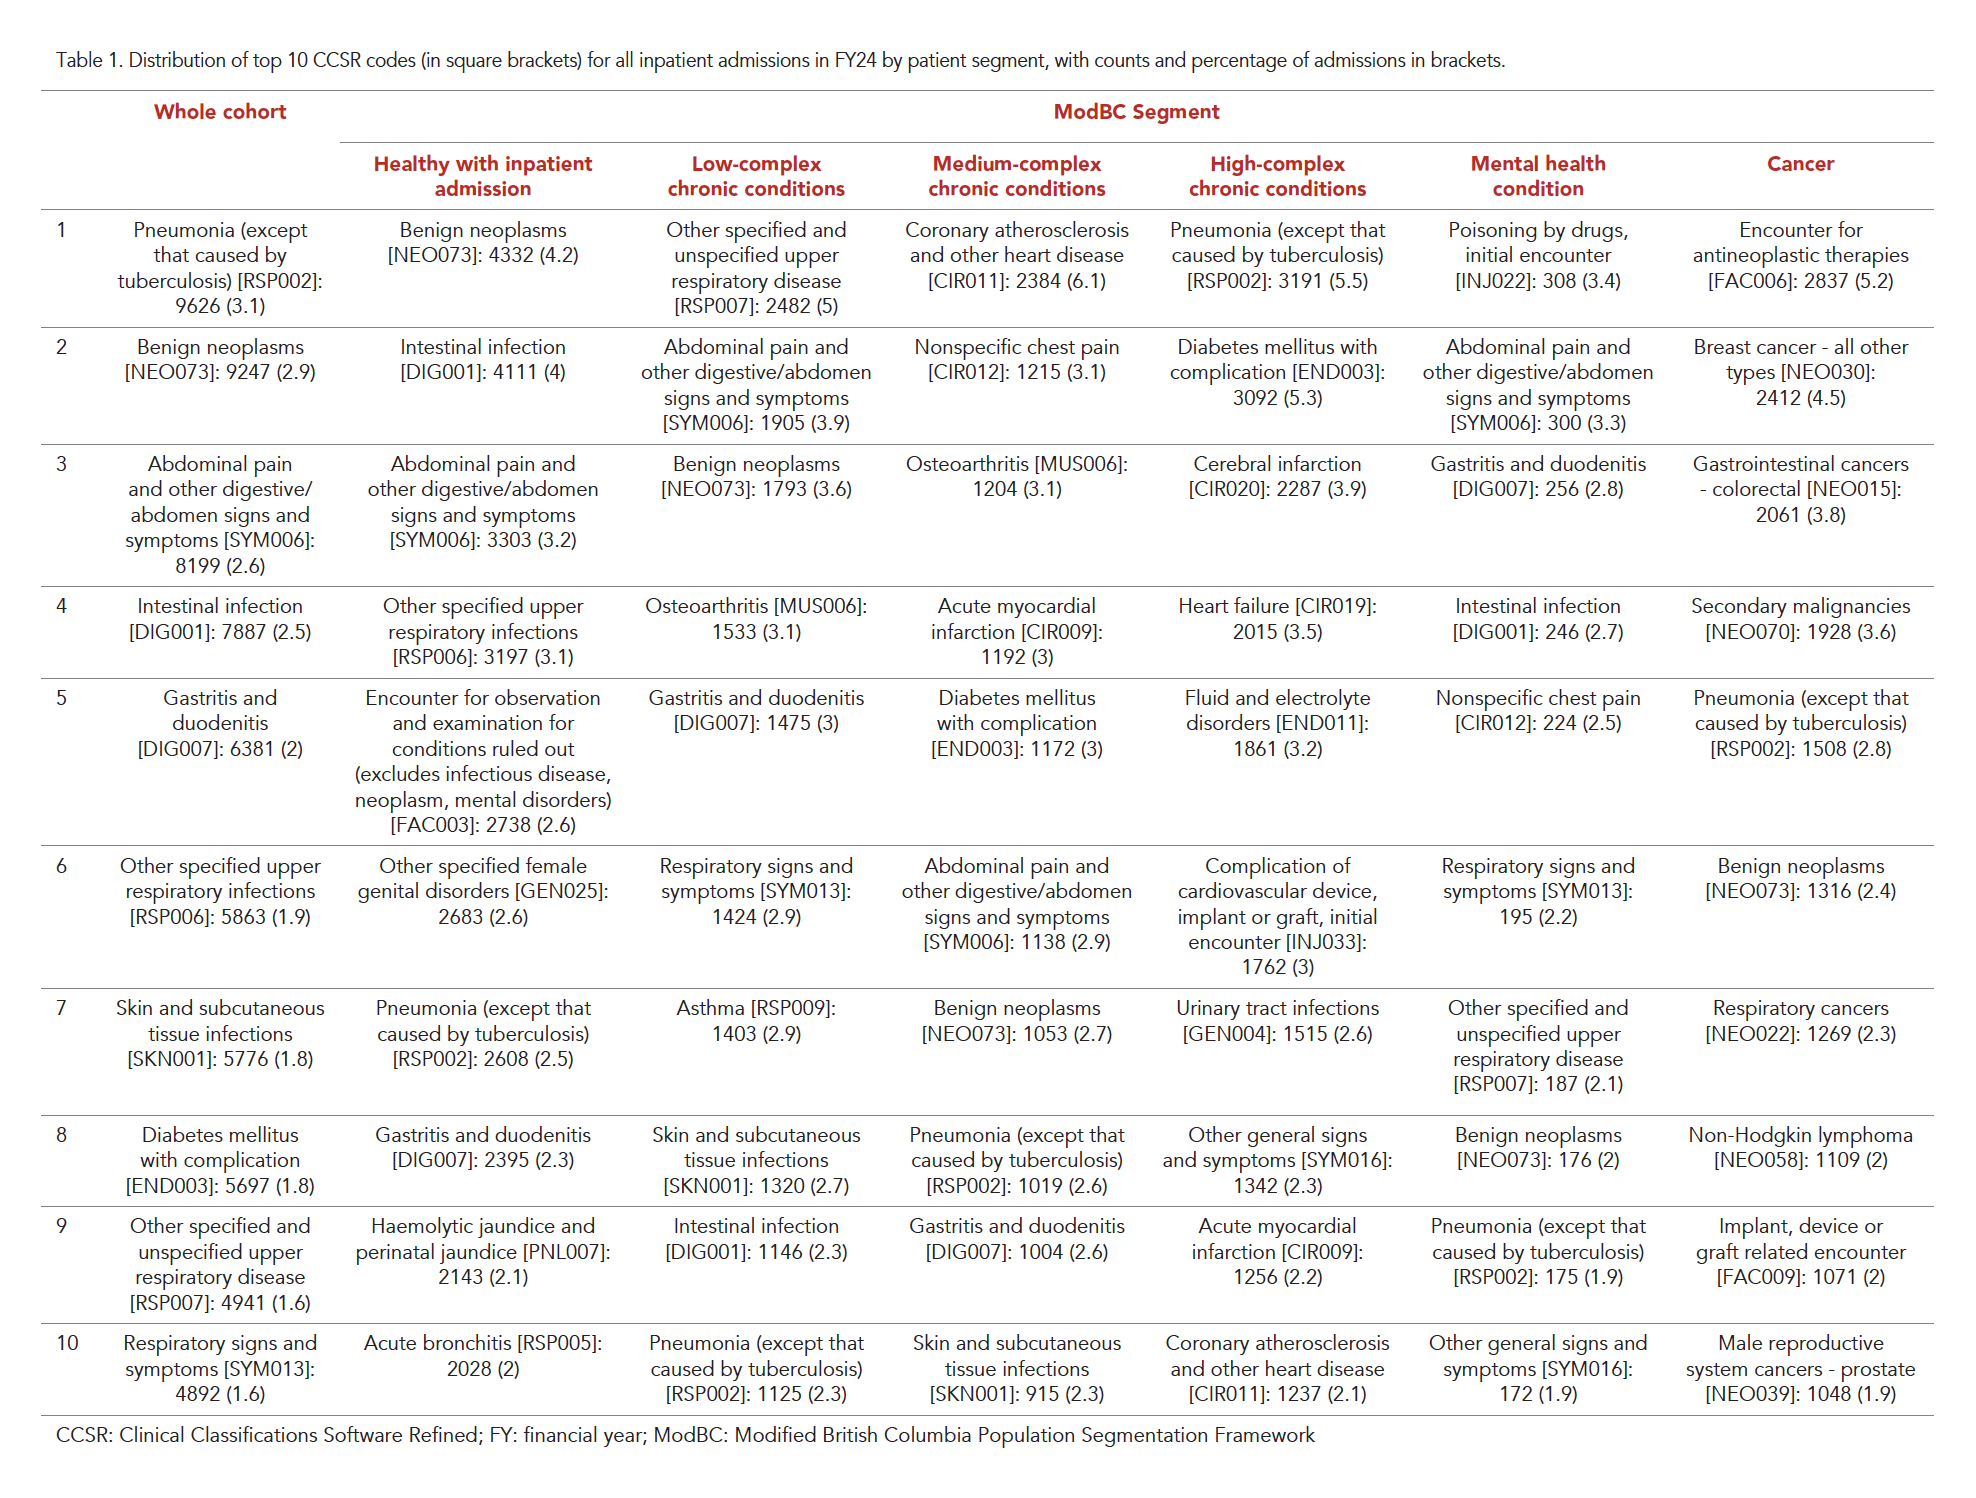
Table 1 presents the top 10 most common reasons from inpatient admissions in 2024 characterised using the CCSR and stratified by modified BC segment. Additional details including the ICD-10-AM codes are provided in Supplementary Tables S6–S12.
The top 10 most common reasons for admission across ModBC patient segments accounted for 21–33% of all admissions and varied by segment, suggesting differing clinical profiles. Among patients classified as healthy with inpatient admission, admissions were primarily for low-acuity conditions such as benign neoplasms, intestinal infections (i.e. gastroenteritis-related conditions), abdominal pain and related symptoms, and upper respiratory infections.
In the low- and medium-complex chronic conditions segments, admissions were characterised by a broader mix of acute and chronic conditions, including upper respiratory disease (i.e. otorhinolaryngology-related conditions), abdominal pain and related symptoms, benign neoplasms, pneumonia, coronary artery disease, and nonspecific chest pain.
For patients in the high-complex chronic conditions segment, admissions were predominantly for pneumonia and complications of chronic diseases. These included diabetes with complications, cerebral infarction, heart failure, fluid and electrolyte disorders, and cardiovascular implant-related complications.
Among patients with mental health conditions, common causes of admission included poisoning by drugs and other low-acuity conditions. In the cancer segment, the most common admissions were for encounters related to antineoplastic therapies, as well as primary and secondary malignancies, particularly breast, colorectal, and respiratory cancers.
Additionally, we compared the top 10 most common CCSR reasons for inpatient admissions in 2024 between adults aged 18–59 years and those aged ≥60 years (Supplementary Tables S4 and S5). Among patients with medium-complexity chronic conditions, there was substantial overlap, with 9 of the top 10 CCSR categories shared between age groups. In contrast, clearer age-related differences were observed among patients with high-complex chronic conditions. Adults aged <60 years were more likely to be admitted for chronic kidney disease, coronary atherosclerosis, nonspecific chest pain, and cutaneous infections, whereas those aged ≥60 years were more frequently admitted for osteoarthritis, pneumonia, and urinary tract infections.
Within the cancer segment, younger adults were more commonly admitted for ductal breast cancer, endocrine system cancers, female reproductive system cancers, and non-Hodgkin lymphoma, while older adults were more likely to be admitted for male reproductive system cancers, respiratory cancers, pneumonia, and urinary tract infections. Overall, diagnosis-level analyses revealed age-related differences in utilisation patterns, particularly within the high-complex chronic and cancer segments.
Table 1. Distribution of top 10 CCSR codes (in square brackets) for all inpatient admissions in FY24 by patient segment, with counts and percentage of admissions in brackets.
DISCUSSION
In this study, we examined healthcare utilisation across the SingHealth cluster, providing a comprehensive view of utilisation trends and factors associated with rising healthcare demand. Leveraging a large longitudinal dataset across the continuum of care, we found that inpatient care remained the largest cost component, increasing substantially in absolute terms while its share of total expenditure remained stable. Healthcare expenditure grew most markedly among patients aged 70–79 years and ≥80 years, with inpatient care accounting for most of this increase. This pattern is consistent with demographic shifts, with increased service use attributable to a growing older population rather than increased utilisation intensity within age groups. Concurrently, inpatient per-user expenditure rose over time, particularly among adults aged ≥60 years, while outpatient and primary care per-user costs remained relatively stable.
Using the ModBC population segmentation framework, we observed a shift towards greater clinical complexity, with growth in the high-complex chronic conditions and cancer segments. Together, these segments accounted for over 40% of total expenditure and were associated with substantially higher per-user costs. Diagnosis-level analyses using CCSR further revealed age-related differences in utilisation patterns within these groups. Taken together, these findings suggest that demographic change and increasing clinical complexity are important factors associated with healthcare utilisation and expenditure.
Demographic shifts and the steepening hypothesis
The demographic shifts observed in our cohort mirror national ageing trends. Singapore is among the world’s fastest ageing societies and is projected to become a super-aged society by 2030.14 Between 2019 and 2024, the proportion of residents aged ≥60 years increased nationally from 21.4% to 25.1%,15 while rising more rapidly in our healthcare cohort from 29.4% to 34.2%. Over the same period, healthcare expenditure for this group in SingHealth increased from SGD 2.24 billion (51.2% of total expenditure) to SGD 3.45 billion (57.0%) (Supplementary Table S3).
Our findings show that population ageing is amplified within healthcare cohorts, with a disproportionate concentration of utilisation and expenditure among older adults. Patients aged ≥60 years had higher total and per-user expenditures and experienced faster expenditure growth over time (Supplementary Fig. S4; Fig. 4C). This is consistent with the steepening hypothesis, which posits that age-specific healthcare spending increases more rapidly among older individuals over time,16,17 as reported in other developed settings.16,18,19
Central to the steepening hypothesis are the dimensions of chronological age, per-user expenditure, and time.19 Over time, demographic shifts are associated with a greater proportion of older individuals within the population, while advances in medical care have extended life expectancy and expanded treatment options for older adults, potentially increasing maintenance costs over the life course.20,21
We did not examine time-to-death and therefore could not assess the widely discussed “red herring” hypothesis, which posits that ageing may not substantially influence healthcare expenditure when adjusted for an individual’s proximity to death.17,21 Nevertheless, the patterns observed in our study remain consistent with several plausible explanations.
First, technological innovation is closely linked to both health outcomes and healthcare costs, highlighting the importance of cost-effective, value-based adoption to support sustainable expenditure growth.17 Second, the interplay between longevity, healthcare innovation, and expenditure suggests that extended survival may be associated with higher long-term costs. Taken together, these findings support a life-course approach to care, which may support informed, value-based decisions that promote healthy ageing and appropriate resource use over time. Within this context, advance care planning and end-of-life discussions remain important to help align care with patients’ values and preferences, and may also shape healthcare utilisation and expenditure.21
Insights from service utilisation rates
Inpatient utilisation remained the dominant driver of healthcare expenditure. Absolute inpatient service utilisation increased markedly over time, particularly among patients aged 70–79 years and ≥80 years (Fig. 3A; Supplementary Fig. S4). However, relatively stable inpatient utilisation rates (Fig. 3B) suggest that this growth is more consistent with the expansion of older age groups rather than with increased utilisation intensity within age groups. This stability may reflect the effectiveness of ongoing efforts to manage demand despite demographic shifts. Notably, the study period spans the COVID-19 pandemic (2020–2022) and post-pandemic recovery. Despite this, we did not observe a clear rebound pattern in utilisation or expenditure, characterised by a transient spike followed by a decline; but rather broadly consistent year-on-year growth throughout the study period. While pandemic-related effects cannot be fully disentangled from underlying secular trends, extending the study period to 2024 provides a longer post-pandemic observation window, improving the interpretability of temporal trends.
Considered alongside rising inpatient per-patient expenditure among older adults aged ≥60 years (Fig. 4), these findings suggest that increasing costs reflect not only population ageing and technological advances but also greater resource intensity per patient, potentially related to increasing clinical complexity and multimorbidity. While CCSR-based analyses provide insight into utilisation reasons, they do not fully capture clinical complexity, and more advanced methods are needed to assess its evolution over time.
Although stable inpatient utilisation rates are desirable, greater utilisation of primary care may be preferable from a system perspective, as it reflects a shift towards lower-cost, community-based care. In the context of Healthier SG, our data include only public-sector primary care utilisation, with private-sector data not yet available. Nevertheless, strengthening primary and community-based care remains critical to moderating inpatient expenditure growth. The success of Healthier SG will depend on addressing persistent barriers to primary care access, including limited consultation time, long waiting times, gaps in continuity of care, provider workload, and administrative burden.22
Clinical complexity as a driver of healthcare expenditure
Clinical complexity, as characterised by the ModBC population segmentation framework, provides an important lens for interpreting patterns of healthcare utilisation and expenditure. By incorporating information from the index year and the preceding 4 years, ModBC assigns patients to mutually exclusive segments as a pragmatic proxy for underlying complexity. Patients in the high-complex chronic conditions and cancer segments accounted for nearly half of total healthcare expenditure, with per-user costs more than twice those of other segments, consistent with an important association between clinical complexity and higher costs.
Diagnosis-level analyses using CCSR further demonstrated that inpatient admissions were increasingly characterised by more complex conditions as ModBC segment severity increases. While ModBC enables identification of high-need patients, the marked heterogeneity in CCSR diagnoses within segments suggests that segmentation alone may be insufficient to guide actionable interventions, consistent with prior studies.23 However, the dimensionality reduction afforded by CCSR allows clinically related conditions to be grouped and could be incorporated into predictive models24,25 as both inputs and outputs. This would enable the development of models that jointly capture utilisation risk and underlying clinical factors—an approach that would be difficult using highly granular ICD-10 codes alone.
Integrating demographic change, healthcare utilisation, and clinical complexity
Taken together, our findings are consistent with a pathway in which population ageing and secular advances in medical care increase the number of clinically complex patients, alongside higher healthcare utilisation and expenditure. Stable utilisation rates across age groups suggest that rising absolute utilisation is more closely associated with shifts in population composition, while increasing inpatient per-user expenditure points to greater resource intensity per patient. In this context, population ageing is a distal, non-modifiable driver of demand, whereas clinical complexity is a more proximal, potentially actionable factor.
Strengths and limitations
This study has several strengths. It uses a large, contemporary patient-level dataset spanning 6 years and the full continuum of care within Singapore’s largest healthcare cluster, enabling robust longitudinal analyses of healthcare utilisation and expenditure. Through patient-level linkage across care settings and application of a population segmentation framework at cluster scale, it provides a granular post-pandemic baseline for system-level planning. These data offer a comprehensive view of utilisation, complexity, and expenditure patterns, with relevance for national policy on healthcare financing, system capacity, and resource planning.
Nevertheless, several limitations should be acknowledged. First, as an observational analysis using routinely collected administrative and clinical data, causal relationships cannot be established. Temporal associations do not imply causality, and the effects of policy changes, demographic shifts, technological advances, and health-seeking behaviours cannot be fully disentangled. Residual confounding, variation in coding practices, and data completeness may introduce bias.
Second, the study period encompasses the COVID-19 pandemic, which disrupted healthcare delivery and utilisation patterns. Although the year-stratified results allow descriptive comparisons across pre-, during-, and post-pandemic phases, we did not perform a formal causal analysis of COVID-19 effects. While isolating its specific impact is challenging, the inclusion of data beyond the acute phase enhances the generalisability of our findings.
Third, this analysis was confined to patients who utilised SingHealth’s services. Although SingHealth serves nearly half of Singapore’s population, utilisation patterns may differ across clusters and geographic areas due to variations in demographics, service configurations, and referral patterns, limiting generalisability.
Fourth, the analysis did not account for patient mobility across clusters or private-sector utilisation, potentially underestimating total healthcare use. Care delivered outside the SingHealth system, including private specialist services, traditional medicine, and overseas treatment, was not captured.
Fifth, this study focused on utilisation and expenditures rather than clinical outcomes such as mortality, disease progression, or functional status. Cost estimates reflect the provider’s perspective and do not capture broader societal costs such as productivity losses or informal caregiving.
Sixth, although comprehensive, the dataset lacks detailed clinical information on disease severity, functional status, comorbidity burden, and quality-of-care metrics, limiting the assessment of the appropriateness and effectiveness of care. While CCSR enables clinically meaningful categorisation, it does not fully capture variation in clinical complexity or resource use over time. This study also did not assess admission avoidability; thus, observed inpatient utilisation and expenditure should not be assumed to represent preventable care. Future work could apply existing MOH frameworks to avoidable admissions to better identify modifiable drivers of inpatient use.
Finally, population segmentation approaches have inherent limitations. While they provide useful strategic insights, patients within each segment remain heterogeneous and findings cannot be directly translated into intervention strategies without more sophisticated analysis.
In summary, rising healthcare utilisation and expenditure appear to be driven by a combination of population ageing and increasing clinical complexity. Advances in medical care have extended life expectancy and expanded treatment options, but have also increased long-term maintenance costs, particularly among older adults. Addressing these challenges will require a sustained shift towards preventive, community-based, and value-driven models of care to ensure long-term system sustainability.
Acknowledgments
This research is supported by the National Medical Research Council Population Health Research Grant (Award No.: MON-PHRGTC-7-0001). The funder was not involved in the design of the study; the collection, analysis, and interpretation of data; writing the report; and did not impose any restrictions regarding the publication of the report.
Supplementary Materials
Supplementary Table S1. Detailed classification criteria for Modified British Columbia Population Segmentation Framework.
Supplementary Table S2. Service utilisation rate (%), with year-on-year change (percentage points) in brackets.
Supplementary Table S3. Expenditure (in SGD millions), with year-on-year change (percentage points) in brackets.
Supplementary Table S4. Distribution of top 10 CCSR codes for inpatient admissions in FY24 and for patients age ≥60 years, by patient segment, with counts and percent of admissions in brackets.
Supplementary Table S5. Distribution of top 10 CCSR codes for inpatient admissions in FY24 and for patients age 18–59 years, by patient segment, with counts and percent of admissions in brackets.
Supplementary Table S6. The 10 most prevalent ICD-10 codes within the 10 most common CCSR categories for the entire SingHealth cohort in Financial Year (FY) 2024.
Supplementary Table S7. The 10 most prevalent ICD-10 codes within the 10 most common CCSR categories for patients in the Modified British Columbia (ModBC) segment—Healthy with inpatient admission.
Supplementary Table S8. The 10 most prevalent ICD-10 codes within the 10 most common CCSR categories for patients in the ModBC segment—Low complex chronic conditions.
Supplementary Table S9. The 10 most prevalent ICD-10 codes within the 10 most common CCSR categories for patients in the ModBC segment—Medium complex chronic conditions.
Supplementary Table S10. The 10 most prevalent ICD-10 codes within the 10 most common CCSR categories for patients in the ModBC segment—High complex chronic conditions.
Supplementary Table S11. The 10 most prevalent ICD-10 codes within the 10 most common CCSR categories for patients in the ModBC segment—Mental health condition.
Supplementary Table S12. The 10 most prevalent ICD-10 codes within the 10 most common CCSR categories for patients in the ModBC segment—Cancer.
Supplementary Fig. S1. Indexed population growth by ethnicity.
Supplementary Fig. S2. Indexed population growth by age band.
Supplementary Fig. S3. Indexed healthcare expenditure growth by ethnicity and type of care.
Supplementary Fig. S4. Indexed healthcare expenditure growth by age group and type of care.
Supplementary Fig. S5. Indexed service utilisation (absolute counts) by age group and type of care.
REFERENCES
- World Health Organization. Global spending on health: emerging from the pandemic, 9 December 2024. https://www.who.int/publications/i/item/9789240104495. Accessed 30 October 2025.
- Latest health spending trends. 19 December 2024. https://www.oecd.org/en/publications/latest-health-spending-trends_df0bb1ba-en.html. Accessed 30 October 2025.
- The Commonwealth Fund. International Health Care System Profiles: Singapore. https://www.commonwealthfund.org/international-health-policy-center/countries/singapore. Accessed 30 October 2025.
- Lim J. Sustainable Health Care Financing: The Singapore Experience. Global Policy 2017;8:103-9.
- World Bank. Current health expenditure (% of GDP): Singapore. https://data.worldbank.org/indicator/SH.XPD.CHEX.GD.ZS?locations=SG. Accessed 25 March 2026.
- gov.sg. Government Health Expenditure, Annual. https://data.gov.sg/datasets/d_a40c83a6f36893fc4611eda91f84eb6b/view. Accessed 25 March 2026.
- Healthier SG. White Paper on Healthier SG, 2022. https://www.healthiersg.gov.sg/resources/white-paper/. Accessed 30 October 2025.
- Hall R, Mondor L, Wodchis W. Applying the British Columbia Health System Matrix (BCHSM) population segmentation framework to support integrated care in Ontario, Canada. Int J Popul Data Sci 2022;7:1788.
- Yan S, Kwan YH, Thumboo J, et al. Characteristics and Health Care Utilization of Different Segments of a Multiethnic Asian Population in Singapore. JAMA Netw Open 2019;2:e1910878.
- Agency for Healthcare Research and Quality. Clinical Classifications Software Refined (CCSR) for ICD-10-CM Diagnoses. https://hcup-us.ahrq.gov/toolssoftware/ccsr/dxccsr.jsp. Accessed 15 October 2025.
- Malecki SL, Loffler A, Tamming D, et al. Development and external validation of tools for categorizing diagnosis codes in international hospital data. Int J Med Inform 2024;189:105508.
- Tan JK, Tan HY, Sng GGR, et al. Integrating Clinical Classifications Software Refined (CCSR), Process Indicators, and Geographic Information System (GIS) Mapping to Inform Population Health Management: Development of an Interactive Dashboard. JMIR Med Inform (Forthcoming). doi:10.2196/80431. Accessed 12 June 2026.
- Department of Statistics, Singapore. SingStat Table Builder – Singapore Residents By Age Group, Ethnic Group And Sex, At End June. https://tablebuilder.singstat.gov.sg/table/TS/M810011. Accessed 30 October 2025.
- Luk SCY. Population Ageing in Singapore. In Fong BYF (ed) Healthy Ageing in Singapore [Internet]. Singapore: Springer Nature Singapore;2023, p. 1-28. https://link.springer.com/10.1007/978-981-99-0872-1_1 doi:10.1007/978-981-99-0872-1_1. Accessed 30 October 2025.
- Department of Statistics, Singapore Population Trends, 2025. https://www.singstat.gov.sg/publication-resources/population-trends-2025. Accessed 10 March 2026.
- Buchner F, Wasem J. “Steeping” of health expenditure profiles. Geneva Papers on Risk and Insurance: Issues and Practice 2006;31:581-99.
- Kallestrup-Lamb M, Marin AOK, Menon S, et al. Aging populations and expenditures on health. J Econ Ageing 2024;29.
- Kollerup A, Kjellberg J, Ibsen R. Ageing and health care expenditures: the importance of age per se, steepening of the individual-level expenditure curve, and the role of morbidity. Eur J Health Econ 2022;23:1121-49.
- Gregersen FA. The impact of ageing on health care expenditures: A study of steepening. Eur J Health Econ 2014;15:979-89.
- Felder S, Werblow A. Does the age profile of health care expenditure really steepen over time? New evidence from Swiss cantons. Geneva Papers on Risk and Insurance: Issues and Practice. 2008;33:710-27.
- Zweifel P, Felder S, Meiers M. Ageing of population and health care expenditure: a red herring? Health Econ 1999;8:485-96.
- Foo KM, Sundram M, Legido-Quigley H. Facilitators and barriers of managing patients with multiple chronic conditions in the community: A qualitative study. BMC Public Health 2020;20:273.
- Tan JK, Zhang X, Cheng D, et al. Using the Johns Hopkins ACG Case-Mix System for population segmentation in a hospital-based adult patient population in Singapore. BMJ Open 2023;13:e062786.
- Tan JK, Quan L, Salim NNM, et al. Machine Learning–Based Prediction for High Health Care Utilizers by Using a Multi-Institutional Diabetes Registry: Model Training and Evaluation. JMIR AI 2024;3:e58463.
- Tan JK, Quan L, Tan HY, et al. Ensemble Machine Learning Models for Predicting Patients With High Usage: Model Validation and Economic Impact Analysis. JMIR Med Inform 2026;14:e77202.
Ethics approval was obtained from the SingHealth Centralised Institutional Review Board (CIRB) prior to initiating this study (SingHealth CIRB reference number: 2022/00892). As all participant data were de-identified, a waiver for participant consent was also obtained.
The authors declare that they have no affiliations or financial involvement with any commercial organisation with a direct financial interest in the subject or materials discussed in the manuscript.
Dr Joshua Tan Kuan, Health Services Research Unit, Singapore General Hospital, Outram Road, Singapore 169608. Email: [email protected]
