

ABSTRACT
Introduction: Prior NHANES studies have reported nonlinear associations of the body roundness index (BRI) with prevalent stroke and frailty. The authors updated these observations using NHANES 1999–2023 and examined the additional contribution of frailty to the BRI-prevalent self-reported stroke association.
Methods: This cross-sectional study included 36,324 adults. Stroke was defined by self-reported physician diagnosis. Survey-weighted logistic regression and restricted cubic splines were used to assess BRI associations. Expanded models were fitted with and without the frailty index (FI). A post hoc 2-piecewise model estimated a potential BRI breakpoint using 1000 bootstrap resamples. Incremental discrimination was evaluated across nested age–sex, age–sex–BRI, and age–sex–BRI–FI models. Analyses were interpreted as cross-sectional associations.
Results: In the primary adjusted model, higher BRI was associated with prevalent self-reported stroke (odds ratio [OR]=1.08, 95% confidence interval [CI] 1.05–1.12). The spline showed increasing odds across lower-to-middle BRI values, followed by attenuation at higher values. The exploratory breakpoint was 6.34 (bootstrap 95% CI 6.14–7.65). In expanded sensitivity analyses, the BRI estimate was attenuated without FI (OR=1.01, 95% CI 0.98–1.04) and became inverse after FI was included (OR=0.91, 95% CI 0.88–0.95). FI remained strongly associated with prevalent self-reported stroke (OR=2.38 per 0.1-unit increase, 95% CI 2.23–2.54). Adding BRI to age and sex increased area under the curve (AUC) from 0.763 to 0.769, while adding FI increased AUC to 0.868.
Conclusion: BRI showed a nonlinear, model-dependent association with prevalent self-reported stroke, and frailty provided additional cross-sectional information. These findings support prospective evaluation of BRI and frailty as complementary markers in stroke-related assessment.
CLINICAL IMPACT
What is New
- In a nationally representative US sample, BRI showed a nonlinear association with prevalent self-reported stroke, while frailty was strongly associated with stroke status.
- This study extends previous NHANES research by comparing BRI estimates across progressively adjusted models and examining the additional contribution of frailty.
Clinical Implications
- BRI and frailty may provide complementary cross-sectional information when characterising adults with prevalent stroke.
- Prospective, population-specific studies are needed before these measures are used for stroke prediction, screening, or clinical decision-making.
Stroke remains one of the most pressing public health challenges worldwide, representing a leading cause of mortality and permanent disability. In the US alone, approximately 795,000 individuals experience a new or recurrent stroke each year, underscoring its substantial public health burden.1,2 Among the modifiable risk factors, obesity—particularly visceral adiposity—has been consistently associated with cerebrovascular disease. In the INTERSTROKE study, 10 potentially modifiable factors collectively accounted for approximately 90% of the population-attributable risk of stroke, whereas abdominal obesity—defined by an elevated waist-to-hip ratio—accounted for 18.6% (95% confidence interval [CI] 13.3%–25.3%).3 Traditional anthropometric indices such as body mass index (BMI) have long been used to classify obesity in both clinical and epidemiological settings. However, BMI fails to distinguish between fat and lean mass or to account for the distribution of adipose tissue, thereby limiting its utility in capturing the metabolic risks associated with central obesity.4
In recent years, the body roundness index (BRI) has emerged as an anthropometric measure that estimates abdominal body shape by incorporating waist circumference and height into an elliptical model of the human body.5,6 Unlike BMI, BRI more directly reflects central adiposity, which is associated with insulin resistance, dyslipidaemia, chronic inflammation, and endothelial dysfunction. BRI has been examined in relation to multiple cardiometabolic outcomes, including diabetes, hypertension, atherosclerosis, cardiovascular events, and mortality.7,8 The present work should therefore be viewed as an extension of the established BRI literature rather than as the first investigation of BRI and cerebrovascular disease.
Beyond adiposity, frailty commonly co-occurs with cerebrovascular disease. Frailty, a clinical syndrome characterised by diminished strength, endurance, and physiological function, has been associated with adverse outcomes in patients with stroke.9,10 Systematic reviews indicate that pre-stroke frailty is present in approximately one-quarter of patients with acute stroke and is strongly associated with mortality, disability, and prolonged hospitalisation.11 Visceral obesity and frailty also share correlates, including chronic inflammation, oxidative stress, and hormonal dysregulation.12 Previous National Health and Nutrition Examination Survey (NHANES) analyses have directly addressed the 2 component associations examined here. Gan et al. analysed 39,454 adults from NHANES 1999–2018 and reported a positive nonlinear association between BRI and prevalent stroke using restricted cubic splines.13 Xu et al. analysed adults aged 60 years or older from NHANES 2007–2018 and reported a positive nonlinear association between BRI and prevalent frailty.14 These studies overlap substantially with the present analysis in both population and variables.
Accordingly, this study does not claim novelty for the BRI–stroke or BRI–frailty associations themselves. The authors update the BRI–prevalent self-reported stroke analysis through NHANES 1999–2023 and extend prior work by reporting model-specific BRI estimates under broader covariate adjustment, examining how the estimate changes after inclusion of FI, and quantifying incremental discrimination and calibration. Because BRI, frailty index (FI), and stroke were measured concurrently, the FI-related analysis is exploratory and descriptive and cannot establish mediation, temporal ordering, prospective risk, or a causal pathway.
METHODS
Study design and sample
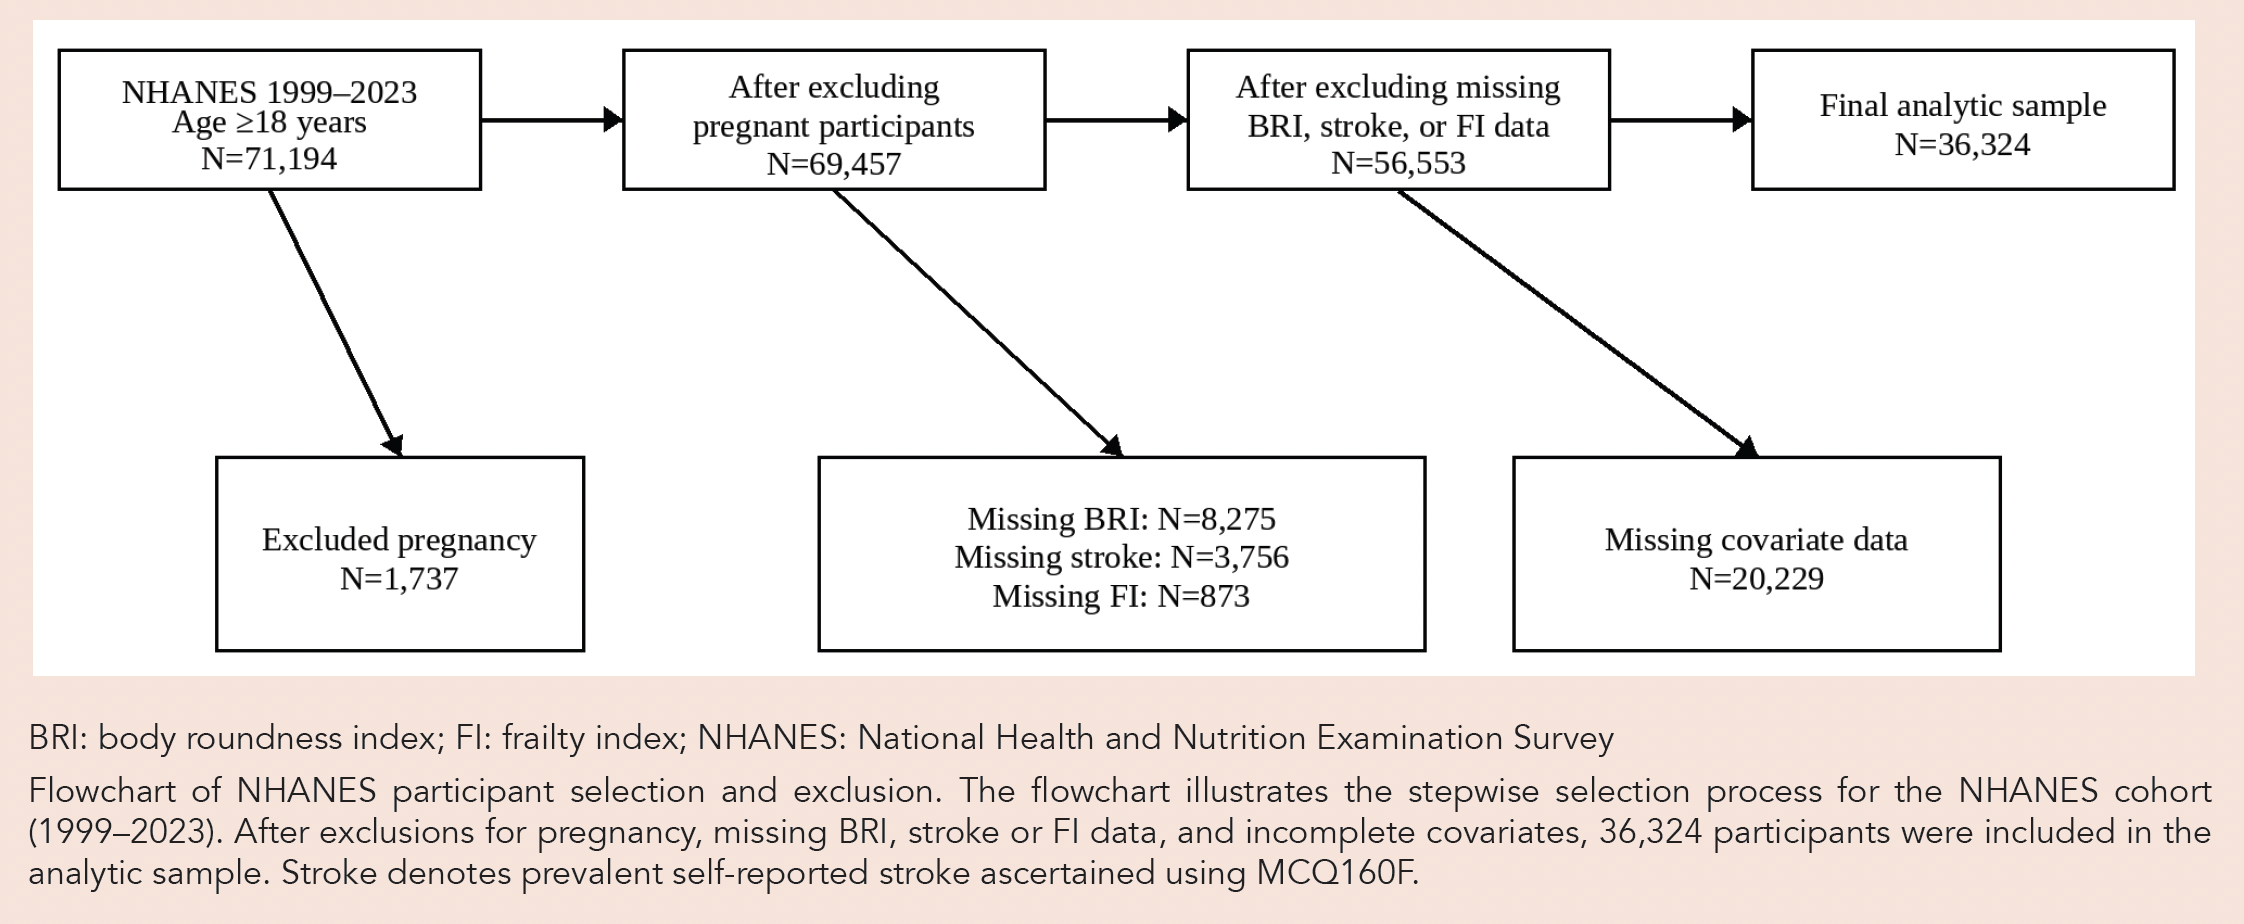
This cross-sectional study used NHANES data from 1999–2023. Participants were included if they were 18 years or older and had complete information on prevalent self-reported stroke status and BRI. The authors excluded individuals who were pregnant at the time of examination, those younger than 18 years, and participants with missing data on BRI, the stroke outcome, or covariates of interest.
After applying these criteria, 36,324 NHANES participants were included in the analytic sample. The participant selection process is summarised in Fig. 1.
Fig. 1. Flowchart of NHANES participant selection and exclusion.
Assessment of stroke
Stroke status was determined using a standardised questionnaire administered during the household interview. Participants were asked whether they had ever been told by a health professional that they had experienced a stroke. Responses were coded using the variable MCQ160F, with “yes” indicating prevalent self-reported stroke and “no” indicating no self-reported history of stroke. This single item did not provide the date of onset, stroke subtype, or validation against medical records or neuroimaging.
Assessment of the BRI
BRI was calculated using the original geometric equation.5 In the equation below, WC denotes waist circumference in metres, H denotes height in metres, π denotes the mathematical constant pi, and 364.2 and 365.5 are constants from the original BRI model. For clinical orientation, BRI values of 5.24 and 6.34 correspond to waist-to-height ratios of approximately 0.592 and 0.639, respectively; for a person 1.70 m tall, these values correspond to waist circumferences of approximately 100.6 cm and 108.6 cm.
Assessment of frailty
Frailty was assessed using a 43-item deficit-accumulation frailty index (FI) constructed according to the standard procedure described by Searle et al.18 Each deficit was coded from 0 to 1, and the FI was calculated as the mean of the 43 deficit scores among participants with complete FI data. Component definitions and scoring are provided in Supplementary Table S2. Descriptive FI values were retained on the original 0–1 scale, and regression estimates were reported per 0.1-unit increase. Hypertension and diabetes were included among the FI deficits; consequently, models that simultaneously included FI and these comorbidities were treated as exploratory sensitivity analyses susceptible to covariate overlap and overadjustment.
Covariates
Potential confounding factors were selected a priori based on established associations with both adiposity and stroke. Demographic variables included age, sex, race and Hispanic origin, marital status, and educational attainment. Socioeconomic status was assessed using the poverty-income ratio (PIR).16 Lifestyle factors comprised smoking history, alcohol consumption, a metabolic equivalent (MET)-based physical activity category, and daily energy intake (kcal/day). Clinical comorbidities included hypertension, diabetes, and hyperlipidaemia. These covariates were incorporated into multivariable models to reduce confounding in the evaluation of the cross-sectional relationships among BRI, frailty, and prevalent self-reported stroke.
Statistical analyses
Analyses were conducted in R version 4.4.2 (R Foundation for Statistical Computing, Vienna, Austria). Survey-weighted estimation used the survey package (version 4.4-2); restricted cubic spline terms were generated using rms (version 8.0-0; Harrell, 2025); breakpoint grid searches used base R statistics (version 4.4.2), with nonparametric resampling implemented using boot (version 1.3-31; Canty & Ripley, 2024 and Davison & Hinkley, 1997); and receiver operating characteristic (ROC) curves and paired DeLong tests used pROC (version 1.18.5; Robin et al., 2011). Cycle-specific examination weights were rescaled for the pooled 1999–2023 analysis, and strata and primary sampling unit identifiers were nested within survey cycle. Continuous variables were summarised as survey-weighted mean ± standard error, and categorical variables as unweighted counts with survey-weighted percentages. Group comparisons used design-based t tests (design degrees of freedom=178) or design-based Wald χ² tests. Logistic regression models for BRI were specified hierarchically. Model 1 was unadjusted; Model 2 included age and sex; Model 3 additionally included smoking and PIR; and the primary Model 4 additionally included education, MET-based physical activity, and energy intake. FI was not included in Models 1–4. An expanded sensitivity model additionally included race and Hispanic origin, marital status, hypertension, diabetes, hyperlipidaemia, and alcohol consumption. FI was then added to the same expanded model to permit a matched model comparison. Because hypertension and diabetes were also FI components, the FI-adjusted model was considered exploratory and potentially affected by covariate overlap and overadjustment; its BRI coefficient was not interpreted as a causal direct effect. Nonlinear associations were assessed using restricted cubic splines adjusted for age, sex, race and Hispanic origin, and PIR. The segmented analysis was post hoc and unadjusted and was therefore not interpreted as direct quantitative confirmation of the adjusted spline. Candidate breakpoints between the 5th and 95th percentiles of BRI were evaluated in 0.01-unit increments, and the value maximising model likelihood was selected. A percentile-based 95% confidence interval for the breakpoint was obtained from 1000 participant-level nonparametric bootstrap resamples. For the secondary incremental-discrimination analysis, conventional unweighted logistic regression was used to permit paired DeLong comparison of correlated ROC curves.17 Three nested models were evaluated: age and sex; age, sex, and BRI; and age, sex, BRI, and FI. Areas under the curve (AUCs) and 95% CIs were estimated using DeLong’s method, and adjacent models were compared using paired DeLong tests. Calibration was evaluated using Brier scores, calibration intercepts, and calibration slopes derived from stratified 10-fold cross-validated predictions. These analyses described classification of contemporaneous prevalent self-reported stroke status and were not interpreted as prospective prediction or screening performance. Regression estimates for FI were expressed per 0.1-unit increase; descriptive FI values and the deficit-scoring table remained on the original 0–1 scale. A two-sided P<0.05 indicated statistical significance.
Ethical considerations
All NHANES protocols were approved by the National Center for Health Statistics Ethics Review Board, and written informed consent was obtained from all participants. The present study used publicly available, de-identified data and required no additional institutional review.
RESULTS
Baseline characteristics
The analytic sample included 1236 unweighted participants with prevalent self-reported stroke and 35,088 participants without self-reported stroke; the survey-weighted prevalence of self-reported stroke was 2.52%. Compared with participants without self-reported stroke, those with prevalent self-reported stroke were older and had lower PIR, lower MET-based physical activity, and lower daily energy intake, whereas a higher proportion belonged to the overweight and obese BMI categories; their mean BRI and FI were also higher. Differences were also observed in sex, educational attainment, smoking status, race and Hispanic origin, marital status, hypertension, diabetes, hyperlipidaemia, and alcohol consumption. In the overall study population, BRI ranged from 1.05 to 23.48, with a mean of 5.24 (standard error=0.02) and a median of 4.84 (Q1=3.61, Q3=6.39). Detailed sociodemographic and clinical characteristics are presented in Table 1.
Table 1. Baseline sociodemographic and clinical characteristics of participants.
Model-specific logistic regression analyses
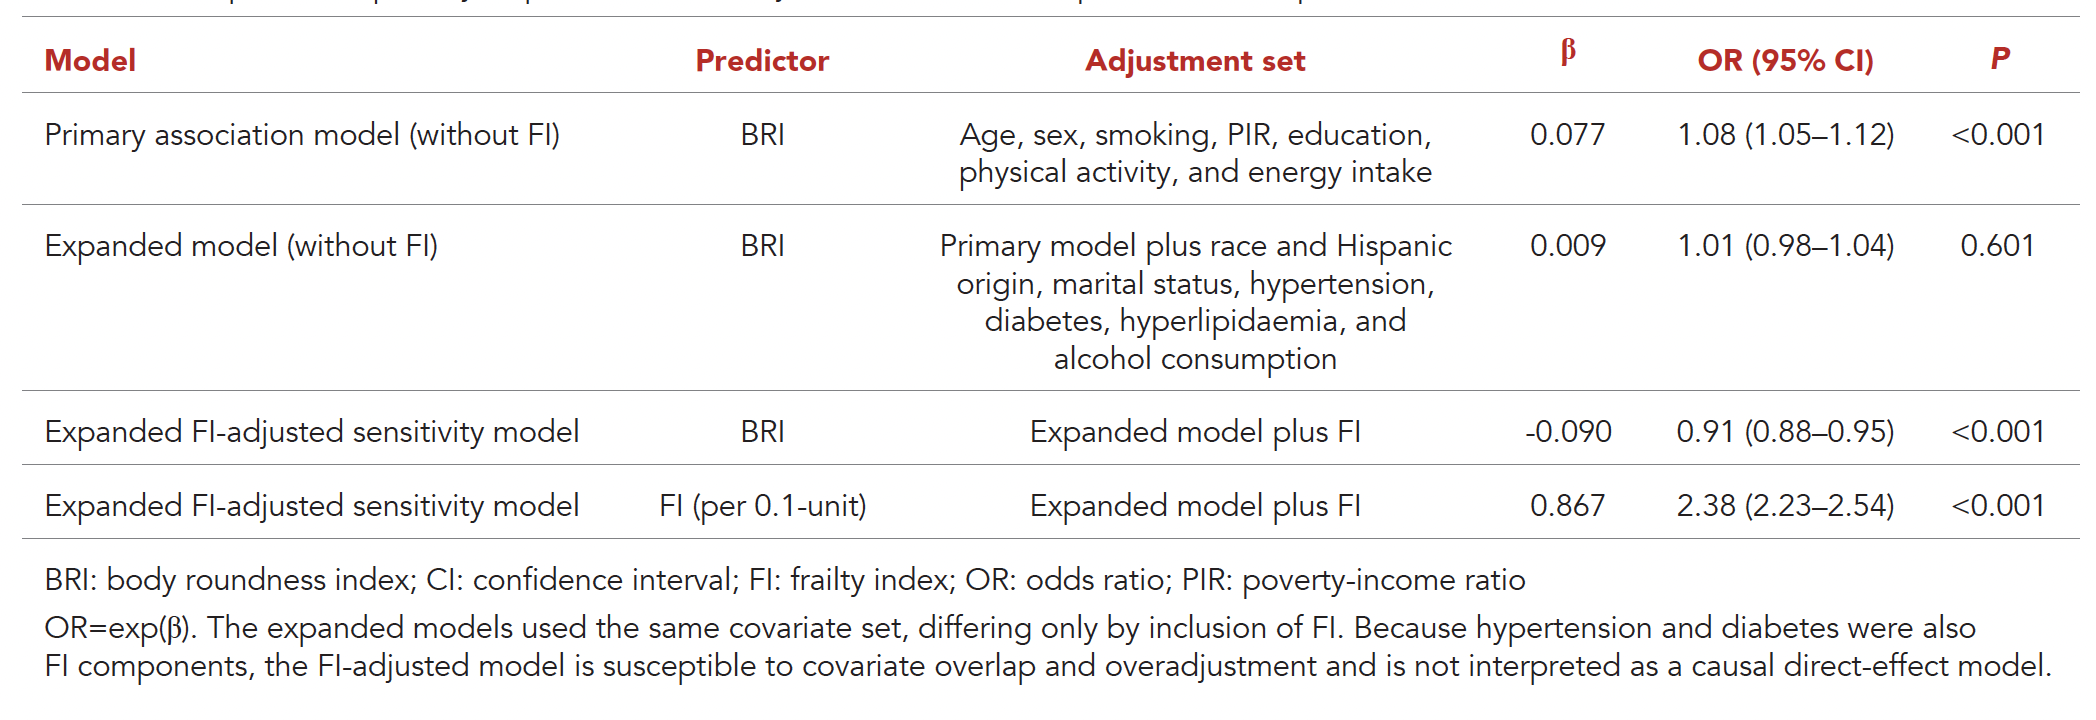
To distinguish the primary BRI association from estimates obtained under broader adjustment and after inclusion of FI, the relevant models are presented separately in Table 2. In the primary model without FI, BRI was positively associated with prevalent self-reported stroke (odds ratio [OR]=1.08, 95% CI 1.05–1.12, P<0.001). In the expanded model without FI, the BRI association was null (β=0.009; OR=1.01, 95% CI 0.98–1.04, P=0.601). After FI was added to the same expanded model, the BRI coefficient was negative (β=-0.090; OR=0.91, 95% CI 0.88–0.95, P<0.001), while FI was strongly associated with prevalent self-reported stroke (β=0.867; OR=2.38 per 0.1-unit increase, 95% CI 2.23–2.54, P<0.001). Because hypertension and diabetes were included both as covariates and as components of the FI, the FI-adjusted estimates may reflect covariate overlap and overadjustment. This model was therefore treated as an exploratory sensitivity analysis and not as a causal direct-effect model.
Table 2. Comparison of primary, expanded, and FI-adjusted BRI models for prevalent self-reported stroke.
Incremental discrimination and calibration analyses
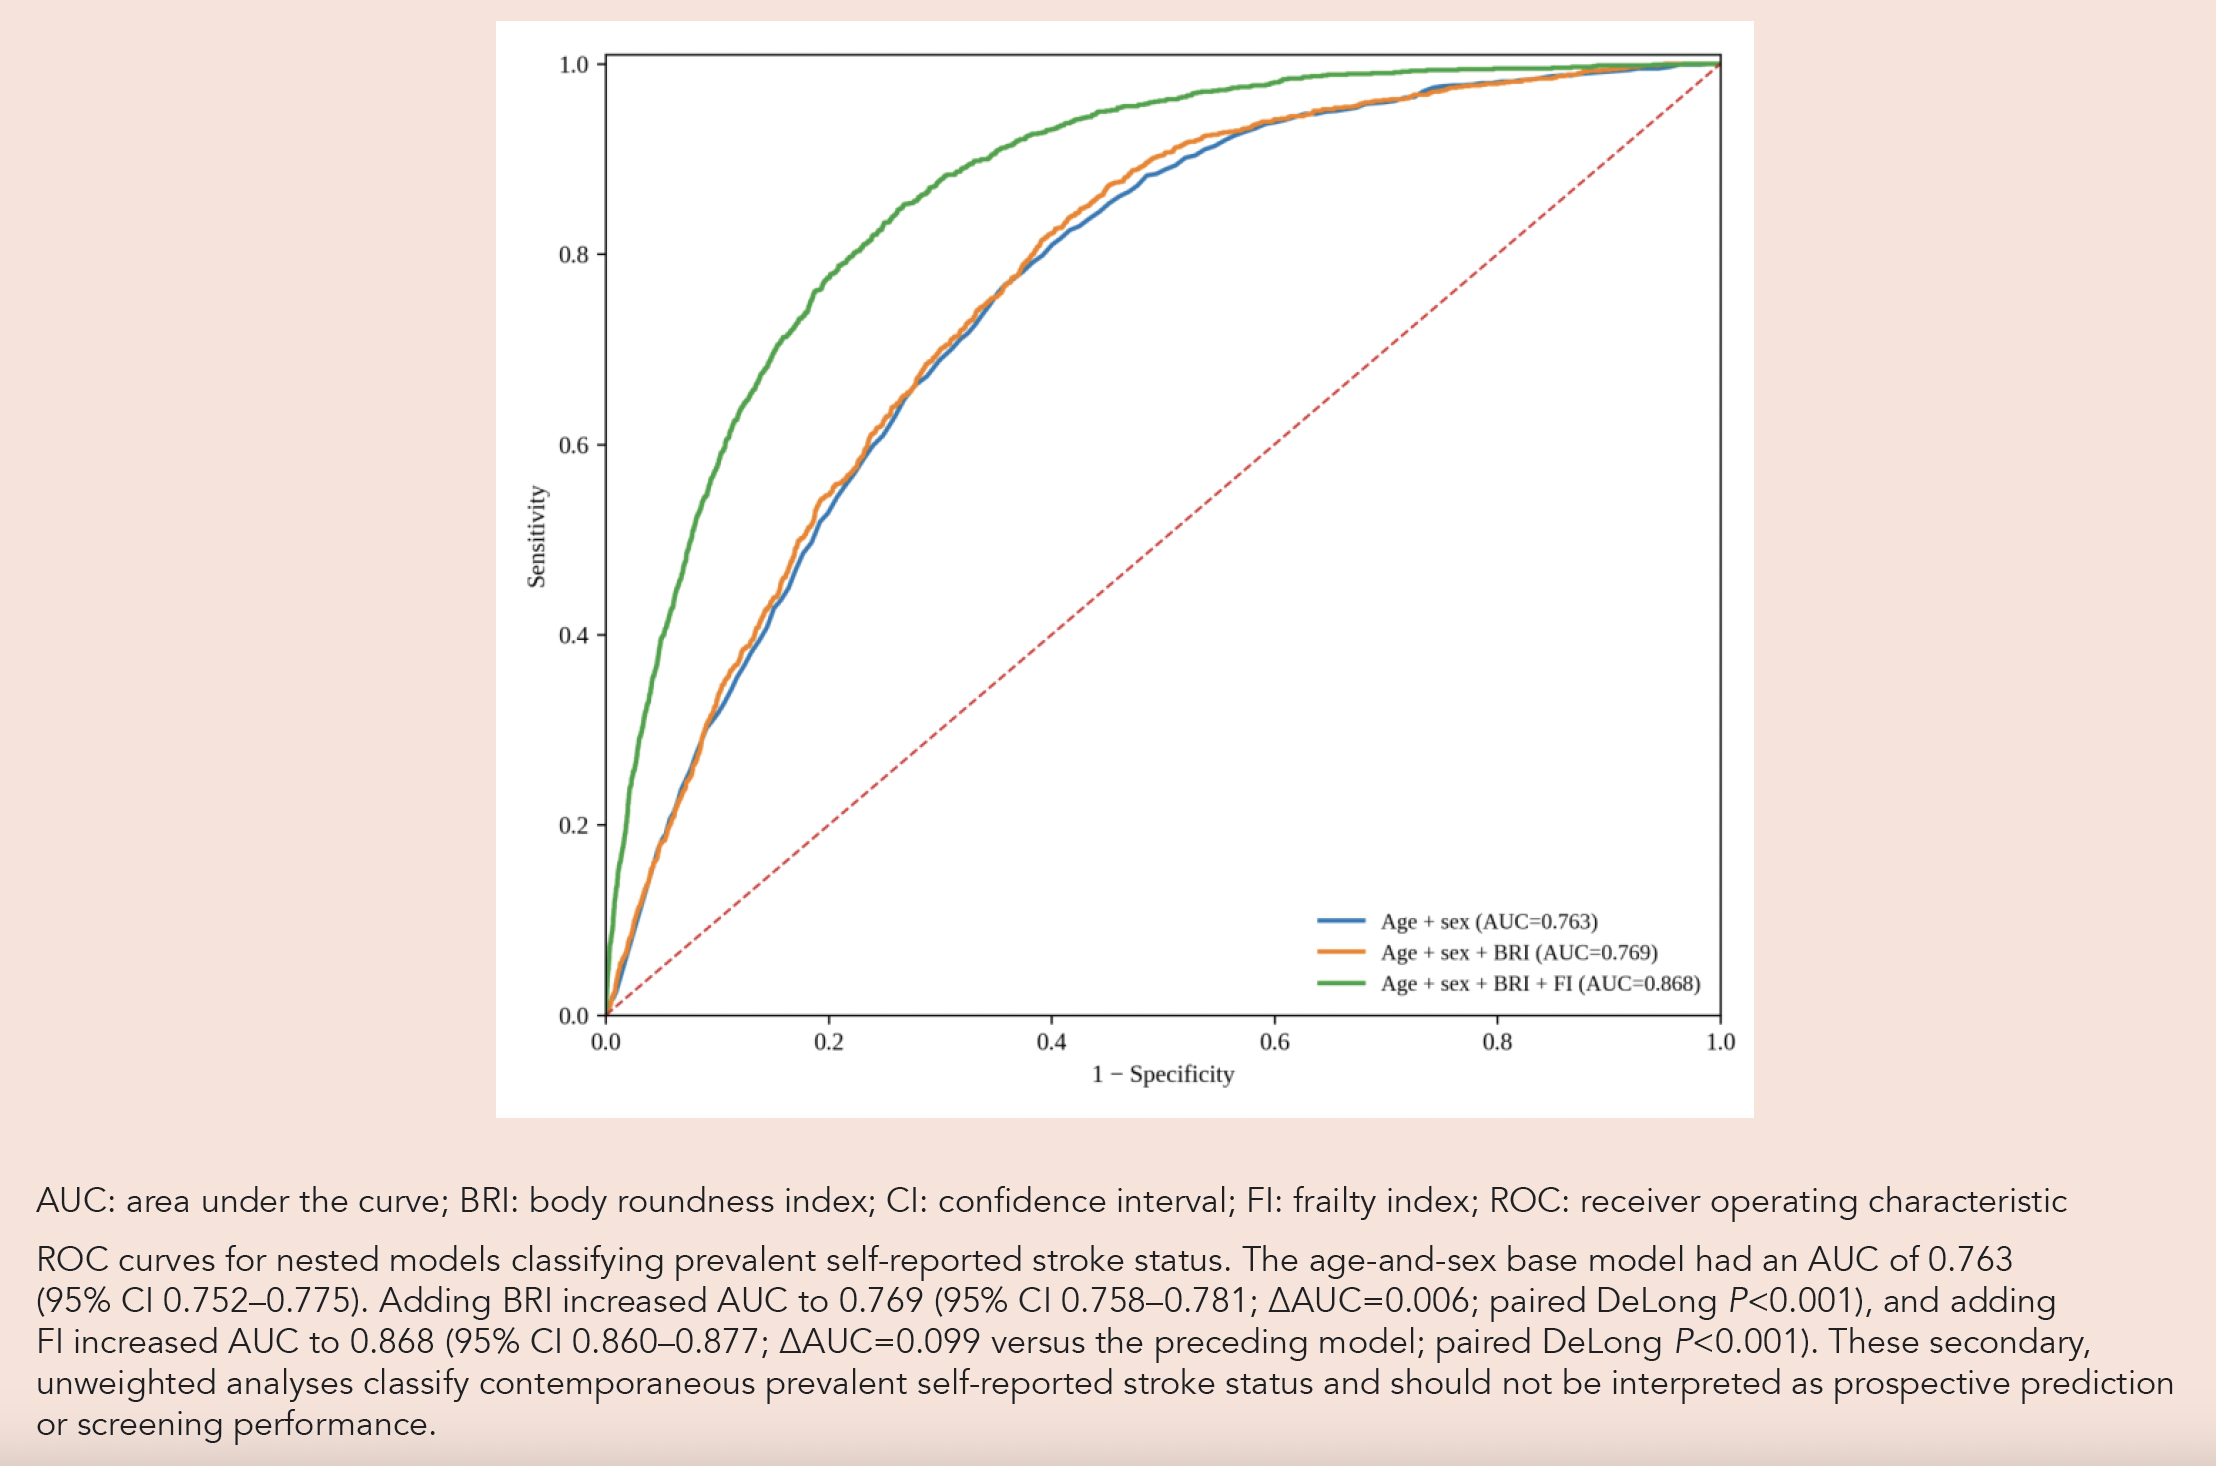
In the secondary unweighted analysis, a prevalence-only model assigning the observed stroke prevalence (3.40%) to every participant had an AUC of 0.500 and a Brier score of 0.0329. The age-and-sex model yielded an AUC of 0.763 (95% CI 0.752–0.775) and a Brier score of 0.0319. Adding BRI increased the AUC to 0.769 (95% CI 0.758–0.781; ΔAUC=0.006; paired DeLong P<0.001) and changed the Brier score minimally to 0.0318. Adding FI increased the AUC to 0.868 (95% CI 0.860–0.877; ΔAUC=0.099; paired DeLong P<0.001) and reduced the Brier score to 0.0297. Thus, the BRI-related improvements in both discrimination and overall prediction error were small. Although the FI-containing model showed a larger numerical improvement, FI was measured concurrently with prevalent stroke and included deficits that may reflect stroke-related disability; these results do not establish prospective predictive value or screening utility.
Table 3. Incremental discrimination and cross-validated calibration for nested models of prevalent self-reported stroke.
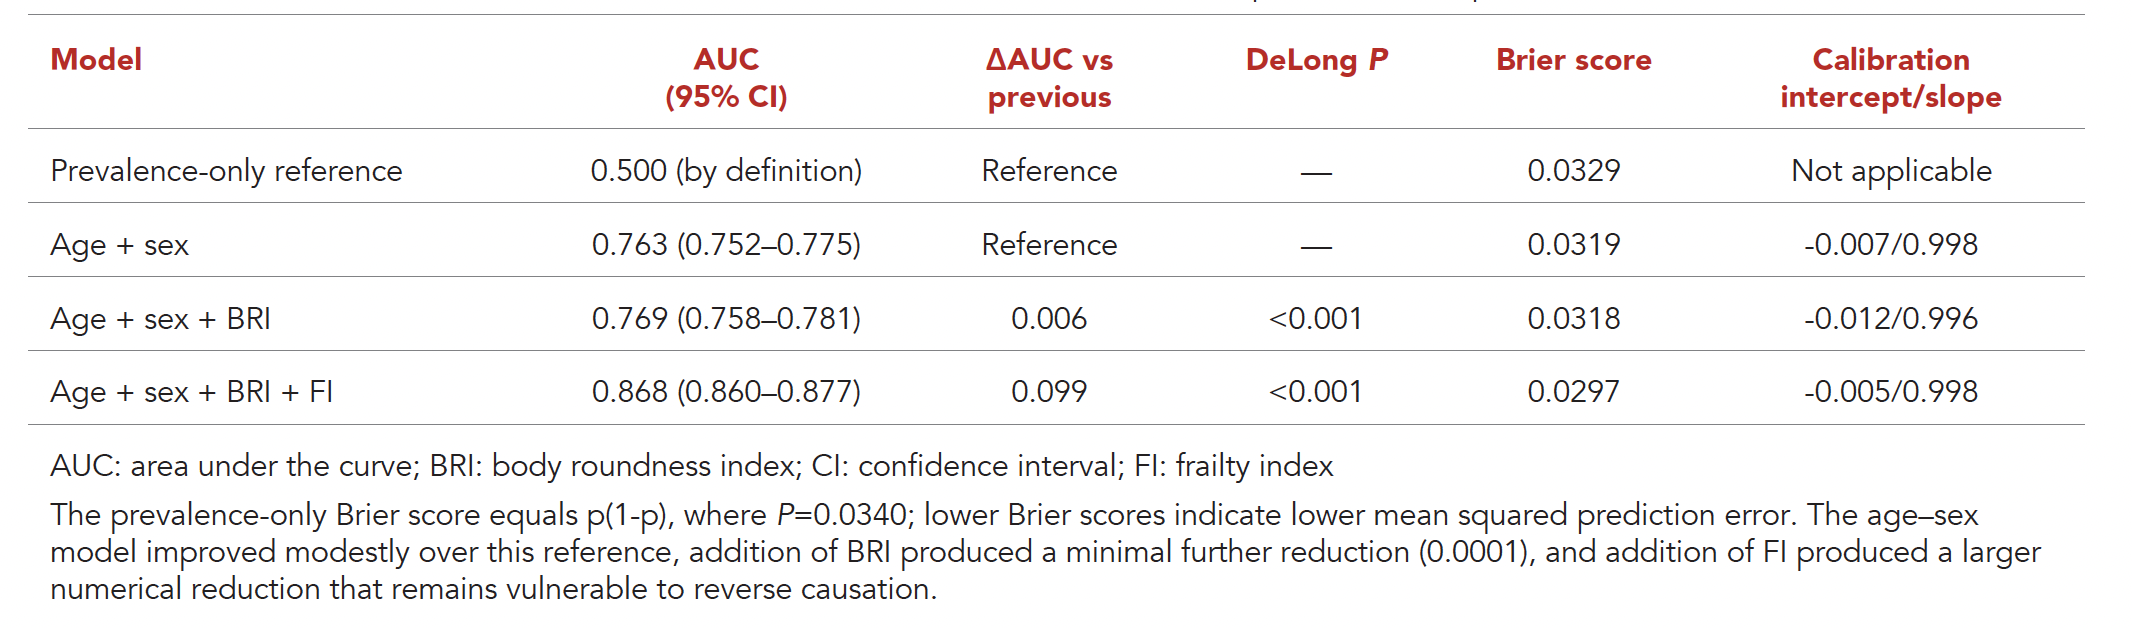
Fig. 2. ROC curves for nested models classifying prevalent self-reported stroke status.
Primary BRI association models without FI
To evaluate the primary cross-sectional association between BRI and prevalent self-reported stroke, logistic regression models were constructed with progressive adjustment for potential confounders; FI was not included in any of these models (Supplementary Table S1). In the unadjusted model (Model 1), BRI was associated with higher odds of prevalent self-reported stroke (OR=1.16, 95% CI 1.13–1.19, P<0.001). After adjustment for age and sex (Model 2), the association remained significant (OR=1.11, 95% CI 1.07–1.14, P<0.001). The association persisted after additional adjustment for smoking and PIR (Model 3; OR=1.09, 95% CI 1.05–1.12, P<0.001). In the primary Model 4, which additionally included education, physical activity, and energy intake, BRI remained positively associated with prevalent self-reported stroke (OR=1.08, 95% CI 1.05–1.12, P<0.001).
Restricted cubic spline analysis
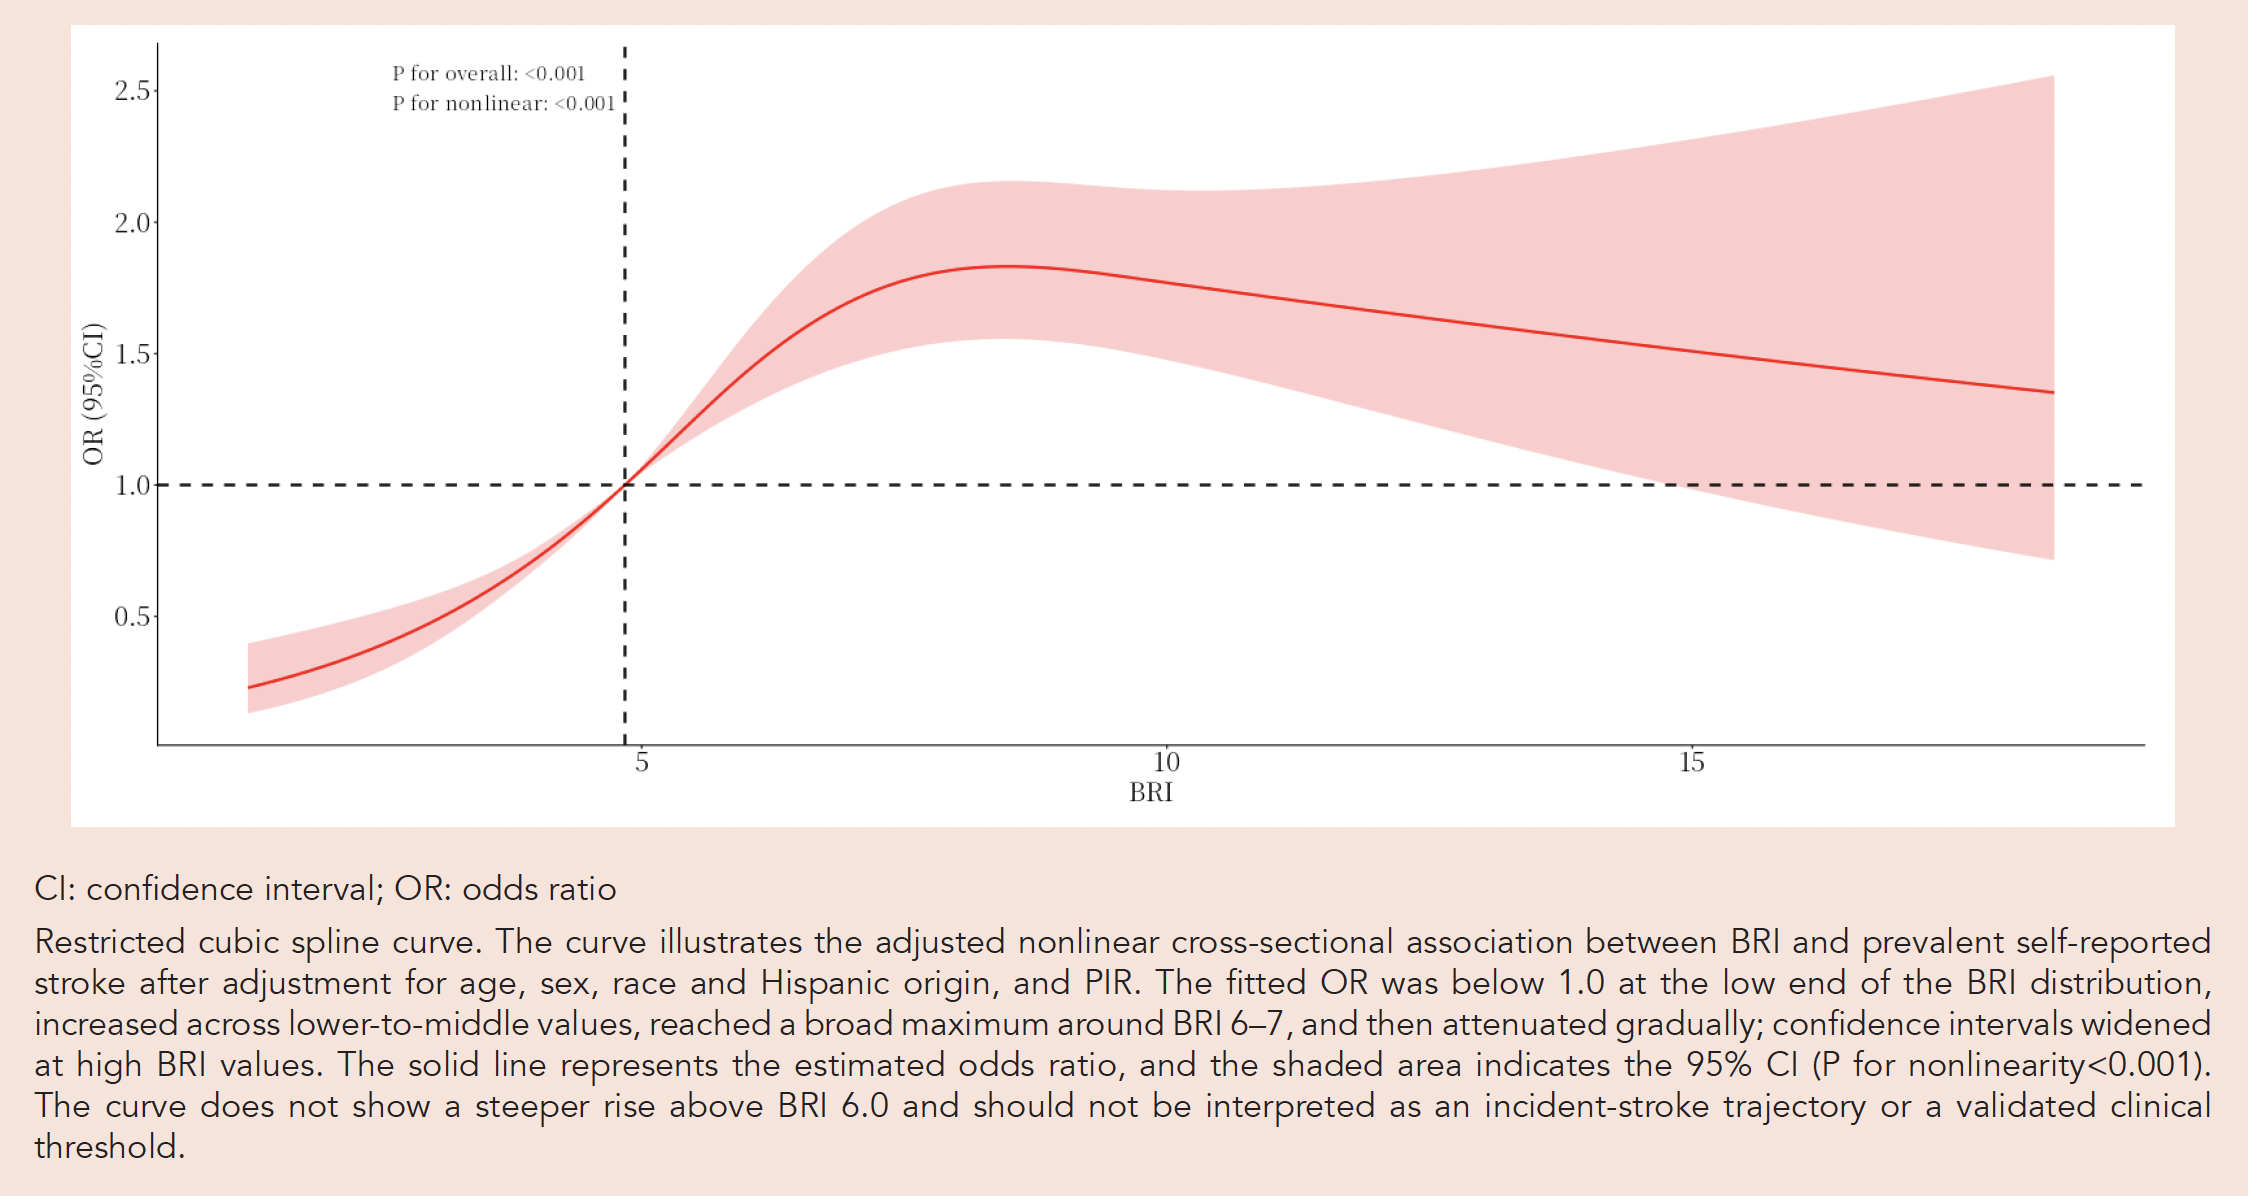
Restricted cubic spline models were used to examine the nonlinear association between BRI and prevalent self-reported stroke after adjustment for age, sex, race and Hispanic origin, and PIR (Fig. 2). At the low end of the observed BRI distribution, the fitted odds ratio was below 1.0 relative to the reference value. The curve then rose across lower-to-middle BRI values, reached a broad maximum around BRI 6–7, and attenuated gradually at higher values, with widening confidence intervals in the sparsely populated upper range (P for nonlinearity<0.001). This pattern does not indicate that individuals with low BRI have high odds of stroke, nor does it establish a prospective dose–response relationship. The spline is presented in Fig. 3.
Fig. 3. Restricted cubic spline curve.
Threshold analysis
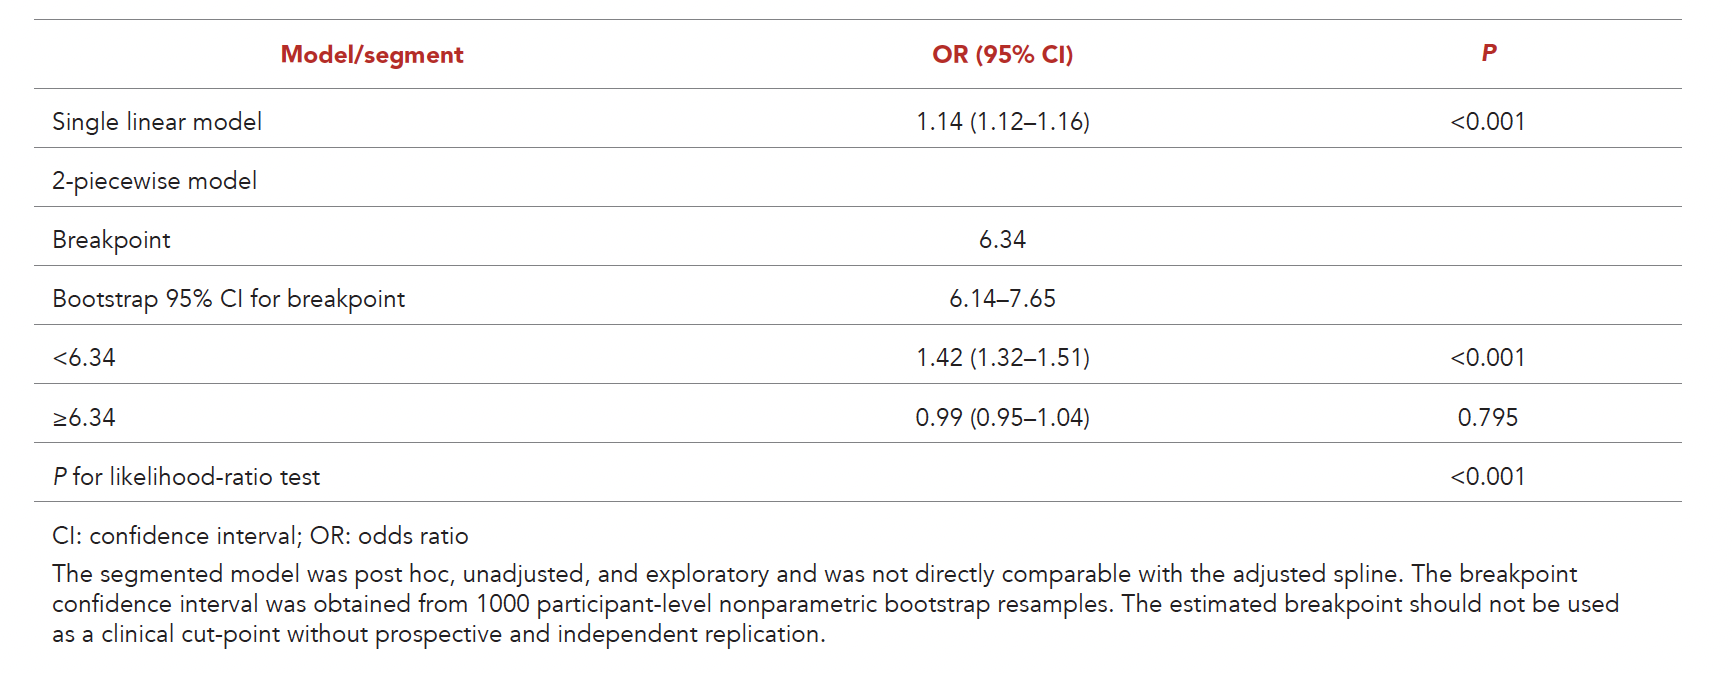
To further characterise the nonlinear association between BRI and prevalent self-reported stroke, a post hoc unadjusted 2-piecewise logistic regression was fitted. The likelihood-ratio test favoured the segmented model over a single linear term (P<0.001). The estimated breakpoint was BRI=6.34, with a bootstrap 95% confidence interval of 6.14–7.65 based on 1000 nonparametric resamples. Below the breakpoint, higher BRI was associated with increased odds of prevalent self-reported stroke (OR=1.42, 95% CI 1.32–1.51, P<0.001). Above the breakpoint, the average slope was null (OR=0.99, 95% CI 0.95–1.04, P=0.795). Because this segmented model was unadjusted whereas the spline model was covariate-adjusted, the 2 analyses do not estimate the same curve and the breakpoint should not be interpreted as confirming the adjusted spline. The breakpoint and apparent plateau are exploratory statistical features rather than established biological or clinical thresholds. The broad uncertainty at high BRI values and lack of replication preclude use of 6.34 as a clinical cut-point. The results are shown in Table 4.
Table 4. Post hoc exploratory unadjusted segmented logistic regression of BRI and prevalent self-reported stroke.
Exploratory cross-sectional decomposition analysis
The exploratory cross-sectional decomposition was interpreted together with the nested model comparison in Table 2. In the expanded model, the BRI estimate was null before FI was included and changed direction after FI adjustment, whereas FI remained strongly associated with prevalent self-reported stroke. Because the FI-adjusted model simultaneously included hypertension and diabetes, which were also FI components, the coefficient change may reflect covariate overlap and overadjustment in addition to any association with frailty. This pattern is therefore better characterised as sensitivity of the adjusted coefficient to model specification than as evidence of a direct or indirect causal effect.
In the model with FI as the outcome, the reported BRI coefficient was β=0.12 on the FI×10 scale, equivalent to a 0.012-unit difference in FI on the original 0–1 scale per 1-unit higher BRI (P<0.001). However, because BRI, FI, and prevalent self-reported stroke were measured concurrently, neither this association nor the change in the BRI coefficient after FI adjustment establishes mediation or temporal ordering. The findings are also compatible with reverse causation, including stroke-related disability increasing the FI.
DISCUSSION
In this updated NHANES cross-sectional analysis, BRI was positively associated with prevalent self-reported stroke in the primary model adjusted for demographic, socioeconomic, and lifestyle factors. The adjusted spline rose across lower-to-middle BRI values and attenuated at higher values. A post hoc unadjusted segmented model yielded a model-dependent breakpoint at BRI=6.34 (bootstrap 95% CI 6.14–7.65); because this model did not use the same adjustment set as the spline, it was not interpreted as confirming the adjusted curve or as identifying a clinical threshold. The BRI estimate was also sensitive to broader covariate adjustment and inclusion of FI: it was null in the expanded model without FI and changed direction after FI adjustment. The latter model included hypertension and diabetes both as covariates and as FI components, so its coefficient change may partly reflect covariate overlap and overadjustment. In secondary discrimination analyses, BRI increased AUC beyond age and sex by only 0.006 and reduced the cross-validated Brier score from 0.0319 to 0.0318, compared with a prevalence-only Brier score of 0.0329. These small changes do not support a clinically meaningful screening claim. Addition of FI produced larger numerical changes (AUC 0.868; Brier score 0.0297), but the FI-related increment may reflect stroke-related disability embedded in the contemporaneously measured FI and cannot establish prospective utility. These model-dependent findings do not support causal mediation, a direct-effect interpretation, clinical prediction, screening, or policy adoption.
The positive association between BRI and prevalent self-reported stroke largely confirms prior NHANES findings rather than establishing a new association. Gan et al. reported a positive nonlinear association using NHANES 1999–2018,13 and longitudinal evidence also links BRI with incident stroke in other populations.19 Unlike BMI, BRI reflects abdominal body shape, and visceral adiposity is associated with atherosclerosis, endothelial dysfunction, and chronic inflammation20,21; BRI has also been linked to broader cardiometabolic abnormalities.22 The present analysis extends the NHANES observation through 2023, but it is not an independent replication because of substantial overlap in survey cycles and participants. The estimated breakpoint was not stable across analyses: Gan et al. reported an inflection point of 8.489,13 whereas the present exploratory estimate was 6.34 (bootstrap 95% CI 6.14–7.65). This lack of concordance argues against treating either value as a reproducible clinical cut-point. The attenuation observed at high BRI values is unlikely to reflect metabolic adaptation. NHANES includes only living respondents who attended the examination, so selective survival may attenuate or distort associations among individuals with the greatest adiposity. Collider or selection bias, reverse causation, post-stroke treatment or weight change, and sparse data at extreme BRI values are additional plausible explanations for the apparent plateau.23,24 Prospective replication with adjudicated incident stroke is required before any threshold interpretation is considered.
The association between BRI and frailty has likewise been established in prior NHANES work. Xu et al. reported a positive nonlinear association between BRI and prevalent frailty among older adults.14 The principal extension in the present study is the exploratory cross-sectional comparison of model-specific BRI estimates before and after FI inclusion, together with the incremental-discrimination analysis. Visceral obesity and frailty may share biological correlates, including chronic inflammation, hormonal dysregulation, and sarcopenia,25-27 while frailty is associated with endothelial dysfunction, hypercoagulability, and reduced physiological resilience.28 In the present analysis, BRI was associated with higher FI, FI was strongly associated with prevalent self-reported stroke, and inclusion of FI materially changed the BRI coefficient. However, this extension is descriptive and methodologically limited: the coefficient change is model-dependent and cannot identify a temporal sequence or distinguish BRI → frailty → stroke from stroke-related disability → higher FI.
Furthermore, the concept of “brain frailty”—characterised by neuroimaging markers such as white matter hyperintensities, cerebral atrophy, and silent infarcts—may provide context for the co-occurrence of frailty and cerebrovascular disease. Frail individuals often exhibit evidence of cerebral small vessel disease and reduced cognitive reserve, which may be associated with stroke vulnerability and recovery. These observations may help explain why frailty and cerebrovascular disease are closely associated, but they do not establish that frailty lies on a causal pathway between BRI and stroke in this cross-sectional analysis.29,30
These findings should be interpreted as descriptive rather than mechanistic. Although BRI and FI were associated with prevalent self-reported stroke status, the concurrent measurement of FI and stroke prevents inference that frailty transmits an effect of adiposity. In particular, a prior stroke may cause functional limitations that increase the FI.
This study has limitations. Stroke was ascertained from a single, undated self-report item and therefore represented prevalent self-reported stroke rather than an incident outcome; the absence of an onset date, stroke subtype, and validation against medical records or neuroimaging, together with the inability to capture silent or fatal strokes, creates potential recall and classification error. Because only survivors who attended the examination were observed, selective survival may bias anthropometric associations and may contribute to attenuation at high BRI values.23,24 Because the analytic sample substantially overlaps with prior NHANES studies of BRI–stroke and BRI–frailty, the present results should not be considered independent replication of those component associations. The threshold analysis was post hoc and unadjusted, whereas the spline was covariate-adjusted; these analyses do not estimate the same curve. Although breakpoint uncertainty was quantified using 1000 bootstrap resamples, the estimate differed from the 8.489 inflection reported in a prior NHANES study and has not been independently replicated. Collider or selection bias, reverse causation, post-stroke treatment or weight change, and sparse data at extreme BRI values may also influence the observed nonlinear shape. The FI-adjusted sensitivity model included hypertension and diabetes both as covariates and as components of the FI, creating covariate overlap and potential overadjustment. The incremental-discrimination analysis was unweighted, internally evaluated, and based on prevalent stroke status. Statistical significance in the DeLong comparisons may partly reflect the large sample size, and the cross-validated calibration estimates do not demonstrate external transportability or prospective performance. BRI, FI, and prevalent self-reported stroke were ascertained at the same examination, and the timing of stroke occurrence relative to BRI and FI assessment was unavailable. Therefore, the FI-related analysis cannot establish mediation, temporality, or causality. A prior stroke may reduce physical activity and functional status and thereby increase the FI; because the 43-item FI includes functional and disability-related deficits that may reflect stroke sequelae, the observed model changes and FI-related classification gain are equally consistent with reverse causation. NHANES also lacks detailed information on treatment or control of hypertension, diabetes, and hyperlipidaemia, and residual confounding is possible. Results may not generalise beyond US adults. Anthropometric relationships and action points are population-dependent; Asian populations may have greater body fat at a given BMI and may experience cardiometabolic risk at lower BMI values than European populations.31 The exploratory BRI breakpoint of 6.34 was derived from a US sample, has not been validated in an Asian general population, and should not be extrapolated as an Asian screening threshold. This study did not assess implementation cost, feasibility, acceptability, equity, or workflow integration. Accordingly, the present evidence is insufficient for clinical, payer, or policy adoption. Larger prospective, population-specific studies with temporally ordered measurements and adjudicated stroke events are required.
CONCLUSION
In summary, BRI showed a model-dependent nonlinear cross-sectional association with prevalent self-reported stroke. The post hoc unadjusted breakpoint estimate was not independently replicated and was not directly comparable with the adjusted spline; it should not be interpreted as a clinical cut-point. The BRI estimate was sensitive to expanded covariate adjustment and inclusion of FI, while frailty remained strongly associated with prevalent self-reported stroke. Because BRI, frailty, and stroke were measured concurrently, and because the FI-adjusted sensitivity model contained overlapping covariates, these findings do not establish mediation, a causal direct effect, or temporal ordering.
Any potential use of BRI or FI for clinical prediction or screening remains hypothetical. The present findings do not support routine screening, use of BRI 6.34 as a clinical threshold, or adoption by clinicians, payers, or policymakers. No general-population Asian validation is available, and population-specific prospective studies with adjudicated stroke events, together with evaluation of implementation cost, feasibility, equity, and workflow, are required before any clinical or policy application is considered.
- Supplementary Table S1. Survey-weighted logistic regression models for prevalent self-reported stroke.
- Supplementary Table S2. Frailty index variable scoring.
REFERENCES
- Global, regional, and national burden of stroke and its risk factors, 1990-2019: a systematic analysis for the Global Burden of Disease Study 2019. Lancet Neurol 2021;20:795-820.
- Tsao CW, Aday AW, Almarzooq ZI, et al. Heart Disease and Stroke Statistics-2023 Update: A Report From the American Heart Association. Circulation 2023;147:e93-e621.
- O’Donnell MJ, Chin SL, Rangarajan S, et al. Global and regional effects of potentially modifiable risk factors associated with acute stroke in 32 countries (INTERSTROKE): a case-control study. Lancet 2016;388:761-75.
- Nuttall FQ. Body Mass Index: Obesity, BMI, and Health: A Critical Review. Nutr Today 2015;50:117-28.
- Thomas DM, Bredlau C, Bosy-Westphal A, et al. Relationships between body roundness with body fat and visceral adipose tissue emerging from a new geometrical model. Obesity (Silver Spring) 2013;21:2264-71.
- Maessen MF, Eijsvogels TM, Verheggen RJ, et al. Entering a new era of body indices: the feasibility of a body shape index and body roundness index to identify cardiovascular health status. PLoS One 2014;9:e107212.
- Tian S, Zhang X, Xu Y, et al. Feasibility of body roundness index for identifying a clustering of cardiometabolic abnormalities compared to BMI, waist circumference and other anthropometric indices: the China Health and Nutrition Survey, 2008 to 2009. Medicine (Baltimore) 2016;95:e4642.
- Zhang X, Ma N, Lin Q, et al. Body Roundness Index and All-Cause Mortality Among US Adults. JAMA Netw Open 2024;7:e2415051. Erratum in: JAMA Netw Open 2024;7:e2426540.
- Fried LP, Tangen CM, Walston J, et al. Frailty in older adults: evidence for a phenotype. J Gerontol A Biol Sci Med Sci 2001;56:M146-56.
- Clegg A, Young J, Iliffe S, et al. Frailty in elderly people. Lancet 2013;381:752-62.
- Burton JK, Stewart J, Blair M, et al. Prevalence and implications of frailty in acute stroke: systematic review and meta-analysis. Age Ageing 2022;51:afac064.
- Veronese N, Cereda E, Stubbs B, et al. Risk of cardiovascular disease morbidity and mortality in frail and pre-frail older adults: Results from a meta-analysis and exploratory meta-regression analysis. Ageing Res Rev 2017;35:63-73.
- Gan J, Yang X, Wu J, et al. Association between body roundness index and stroke results from the 1999-2018 NHANES. J Stroke Cerebrovasc Dis 2025;34:108243.
- Xu J, Sun M, Chen M, et al. Association between body roundness index and frailty in older Americans: a cross-sectional study of NHANES 2007-2018. Front Nutr 2025;12:1534464.
- Zhou D, Liu X, Huang Y, et al. A nonlinear association between body roundness index and all-cause mortality and cardiovascular mortality in general population. Public Health Nutr 2022;25:3008-15.
- Johnson CL, Paulose-Ram R, Ogden CL, et al. National health and nutrition examination survey: analytic guidelines, 1999-2010. Vital Health Stat 2 2013:1-24.
- DeLong ER, DeLong DM, Clarke-Pearson DL. Comparing the areas under two or more correlated receiver operating characteristic curves: a nonparametric approach. Biometrics 1988;44:837-45.
- Searle SD, Mitnitski A, Gahbauer EA, et al. A standard procedure for creating a frailty index. BMC Geriatr 2008;8:24.
- Peng L, Wen Z, Xia C, et al. Association between body roundness index and stroke incidence among middle-aged and older adults in China: a longitudinal analysis of the CHARLS data. Postgrad Med J 2025;101:1057-63.
- Neeland IJ, Ross R, Després JP, et al. Visceral and ectopic fat, atherosclerosis, and cardiometabolic disease: a position statement. Lancet Diabetes Endocrinol 2019;7:715-25.
- Gregor MF, Hotamisligil GS. Inflammatory mechanisms in obesity. Annu Rev Immunol 2011;29:415-45.
- Xu J, Zhang L, Wu Q, et al. Body roundness index is a superior indicator to associate with the cardio-metabolic risk: evidence from a cross-sectional study with 17,000 Eastern-China adults. BMC Cardiovasc Disord 2021;21:97.
- Hernán MA, Hernández-Díaz S, Robins JM. A structural approach to selection bias. Epidemiology 2004;15:615-25.
- Banack HR, Kaufman JS. The obesity paradox: understanding the effect of obesity on mortality among individuals with cardiovascular disease. Prev Med 2014;62:96-102.
- Batsis JA, Villareal DT. Sarcopenic obesity in older adults: aetiology, epidemiology and treatment strategies. Nat Rev Endocrinol 2018;14:513-37.
- Kalinkovich A, Livshits G. Sarcopenic obesity or obese sarcopenia: A cross talk between age-associated adipose tissue and skeletal muscle inflammation as a main mechanism of the pathogenesis. Ageing Res Rev 2017;35:200-21.
- Soysal P, Stubbs B, Lucato P, et al. Inflammation and frailty in the elderly: A systematic review and meta-analysis. Ageing Res Rev 2016;31:1-8.
- Walston J, McBurnie MA, Newman A, et al. Frailty and activation of the inflammation and coagulation systems with and without clinical comorbidities: results from the Cardiovascular Health Study. Arch Intern Med 2002;162:2333-41.
- Appleton JP, Woodhouse LJ, Adami A, et al. Imaging markers of small vessel disease and brain frailty, and outcomes in acute stroke. Neurology 2020;94:e439-e52.
- Bu N, Khlif MS, Lemmens R, et al. Imaging Markers of Brain Frailty and Outcome in Patients With Acute Ischemic Stroke. Stroke 2021;52:1004-11.
- Appropriate body-mass index for Asian populations and its implications for policy and intervention strategies. Lancet 2004;363:157-63.
The present study used publicly available, de-identified data and required no additional institutional review.
This study was funded by the Shanghai Second Rehabilitation Hospital Research Project (Y2025-07) and the Medical Talents Training Program of Shanghai Pudong New Area Health Commission (PWRq2026-43). The authors declare that they have no other affiliations or financial involvement with any commercial organisation with a direct financial interest in the subject or materials discussed in the manuscript. Generative artificial intelligence was used solely for English-language editing and stylistic refinement; the authors critically reviewed and revised all AI-assisted text and take full responsibility for the accuracy, integrity, and content of the manuscript.
Correspondence: Professor Lei Fang, The Second Rehabilitation Hospital Affiliated to Shanghai University of Traditional Chinese Medicine, No. 25, Lane 860, Changjiang Road, Baoshan District, Shanghai, China. Email: [email protected]; Professor Jun Hu, The Second Rehabilitation Hospital Affiliated to Shanghai University of Traditional Chinese Medicine, No. 25, Lane 860, Changjiang Road, Baoshan District, Shanghai, China. Email: [email protected]
