

ABSTRACT
Introduction: Although monocyte and albumin levels have been associated with survival in various malignant tumours, their specific prognostic significance in nasopharyngeal carcinoma (NPC) remains under-explored. This study seeks to examine the relationship between the monocyte-to-albumin ratio (MAR) and overall survival (OS) in NPC patients to create a precise prediction model.
Methods: The authors retrospectively analysed data from 860 NPC patients who underwent concurrent chemoradiotherapy. The optimal cut-off for MAR was determined using the maximum selection log-rank method. Univariate and multivariate Cox proportional hazards models were applied to identify factors significantly related to OS. A predictive nomogram was then developed and rigorously validated for its accuracy.
Results: The optimal MAR threshold was determined to be 11.63, effectively categorising the 860 NPC patients into 2 prognostic subgroups (hazard ratio 0.56; 95% confidence interval [CI] 0.41–0.77, P<0.001). The predictive nomogram exhibited strong predictive capability for OS, factoring in T stage, N stage, MAR value, body mass index, and age over 45 years. The concordance index (C-index) of the traditional tumour–node–metastasis staging system was found to be 0.64 (95% CI 0.57–0.70), which was less than the C-index of the nomogram (0.68; 95% CI 0.64–0.72) for OS.
Conclusion: MAR was identified as an innovative and independent prognostic factor in NPC patients, presenting a potential biomarker for personalised treatment strategies.
CLINICAL IMPACT
What is New
- The monocyte-to-albumin ratio (MAR) is identified as a novel, independent prognostic biomarker for nasopharyngeal carcinoma (NPC).
- MAR uniquely reflects the combined burden of tumour-promoting inflammation (e.g. tumour-associated macrophage infiltration) and systemic malnutrition.
Clinical Implications
- As a readily accessible and cost-effective blood-based index, MAR facilitates early and precise risk stratification in clinical practice.
- Integrating MAR into routine pretreatment assessments can help optimise therapeutic strategies and improve long-term surveillance for NPC patients.
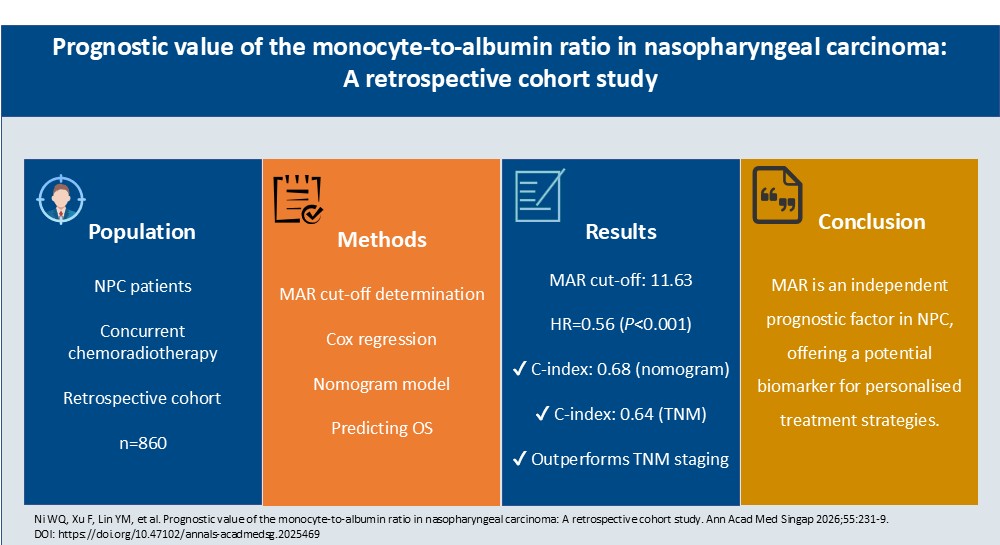
The incidence of nasopharyngeal carcinoma (NPC) is notably elevated in southern China, North Africa, and Southeast Asia (up to 35 cases per 100,000 inhabitants), revealing significant geographical disparities.1 Approximately 70% of NPC patients are diagnosed with locally advanced disease, contributing to an estimated 80,000 deaths annually from this malignancy worldwide.2 The tumour–node–metastasis (TNM) staging system is a cornerstone for forecasting prognosis and informing treatment approaches in NPC.1 Concurrent chemoradiotherapy (CCRT) is recognised as the standard treatment for locally advanced NPC.1,3 Nonetheless, notable variability in prognosis exists among patients even when categorised under the same TNM staging and treatment modalities.4,5 This discrepancy underscores the limitations of the TNM system in capturing the biological diversity inherent in NPC.
Recent research emphasises the critical interplay between the tumour microenvironment (TME) and immune responses, alongside the influence of nutritional and metabolic conditions on tumour advancement and metastasis.6-8 Current investigations have indicated that indicators reflecting inflammation and nutritional status significantly affect the prognosis of various malignancies, including NPC. Specifically, systemic inflammatory responses can drive tumour metastasis by promoting angiogenesis and preventing cellular apoptosis. Furthermore, nutritional deficits that are often reflected by low haemoglobin levels can lead to tumour hypoxia, which further accelerates angiogenesis and worsens the patient’s prognosis. Metrics such as the ratios of inflammatory markers (e.g. neutrophils, lymphocytes, platelets, and C-reactive protein) and nutritional status indicators (e.g. controlled nutritional status and prognostic nutritional index) have been investigated extensively.9-11 Composite indicators that amalgamate these parameters have proven to be more effective in tumour diagnosis and prognosis than single indicators.12 Consequently, researchers are increasingly focusing on composite biomarkers that fuse inflammation and nutritional aspects for improved risk stratification among NPC patients. The monocyte-to-albumin ratio (MAR) represents such a composite index, integrating inflammatory markers with nutritional parameters to provide insights into a patient’s systemic inflammatory state and nutritional health.13 In many cancers, monocytes that infiltrate tumour tissues can differentiate into tumour-associated macrophages (TAMs), which constitute a crucial component of TME.14 These TAMs generally polarise into 2 distinct subtypes: M1-like and M2-like TAMs. Notably, the M2-like TAMs play a critical role in promoting malignant metastasis, invasion, and treatment resistance.15 Therefore, peripheral monocyte levels offer a practical reflection of the systemic TAM burden. By specifically utilising monocytes rather than overall leukocyte counts, MAR highlights the crucial intersection of TAM-driven tumour-promoting inflammation and cancer-related malnutrition. However, studies examining the significance of MAR in NPC are still limited.
This research aims to investigate the correlation between pre-treatment MAR levels and the prognosis of NPC patients receiving CCRT.
METHODS
Patients
This retrospective analysis included 860 patients with histologically confirmed NPC who received treatment at Sun Yat-sen University Cancer Center between January 2010 and December 2014. Inclusion criteria were as follows: (1) imaging and histological evaluations confirmed untreated, non-metastatic NPC; (2) no history of other tumours or inflammatory conditions; (3) treatment via radical intensity-modulated radiation therapy (IMRT); (4) platinum-based concurrent chemotherapy administered during IMRT, either weekly or every 3 weeks; (5) peripheral blood tests and Epstein-Barr virus (EBV) DNA assessments specific to NPC completed prior to treatment. All patients were staged according to the 8th American Joint Committee on Cancer TNM staging system. This study was approved by Sun Yat-sen University Cancer Center’s Ethics Committee (SL-B2023-537-01), which waived the necessity for written informed consent. All procedures were conducted in compliance with the principles outlined in the 1964 Helsinki Declaration and its amendments. Medical histories, imaging data, and pathological reports were reviewed to extract data within 7 days following diagnosis. Treatment protocols and follow-up routines adhered to established guidelines. Patients were stratified into 3 body mass index (BMI) categories: <24, 24–27.9, ≥28 kg/m². MAR was defined as the ratio of monocyte counts (number/mm³) to albumin levels (g/L).16,17
Statistical analysis method
Sample size calculation was not performed due to a lack of prior data to justify the establishment of prognostic models. Of the 860 enrolled participants, 174 events were documented during the follow-up, ensuring that in the multivariate model, a minimum of 10 events per variable was maintained for adequate evaluative capacity.18 MaxStat R package (by Torsten Hothorn) along with the Kaplan-Meier method was utilised to identify the optimal cut-off value and develop survival curves, followed by a log-rank test.19 The proportional hazards assumption was evaluated using Schoenfeld residual analysis. Only variables with a P value of <0.10 in the univariate analysis were included in the multivariate Cox model. A nomogram was subsequently constructed based on the findings from the multivariate analysis.
The efficacy of the nomogram was evaluated using calibration curves, the concordance index (C-index), and the area under the curve (AUC) through time-dependent receiver operating characteristic (ROC) analysis. Statistical significance was established at a 2-sided P<0.10. All statistical computations were performed using R software version 4.2.1 (R Foundation for Statistical Computing, Vienna, Austria).
RESULTS
Patient characteristics
Table 1 outlines the baseline characteristics of the 860 NPC patients included in this study at Sun Yat-sen University Cancer Center. The median age of the participants was 45 years (range: 18–84 years), with 423 patients (49.2%) older than 45 years and 437 patients (50.8%) aged 45 years or younger. The majority were male (639 cases, 74.3%), while females constituted approximately one-quarter of those studied (221 cases, 25.7%). Most patients were diagnosed with World Health Organization type III carcinoma (98.5%). The EBV-DNA value was ≥4000 copies/mL in nearly one-third of the patients. Using the identified MAR cut-off value of 11.63 (Fig. S1), patients were classified into 2 groups: a high MAR group with scores greater than 11.63 (n=232) and a low MAR group with scores less than or equal to 11.63 (n=628).
Table 1. Baseline characteristics of the study participants.
|
Characteristic |
All (n=860) |
% |
|
Age |
|
|
|
>45 years |
423 |
49.2 |
|
≤45 years |
437 |
50.8 |
|
Sex |
|
|
|
Female |
221 |
25.7 |
|
Male |
639 |
74.3 |
|
Histological type |
|
|
|
WHO Ⅰ/Ⅱ |
13 |
1.51 |
|
WHO Ⅲ |
847 |
98.5 |
|
HGB |
|
|
|
<113 g/L |
27 |
3.14 |
|
113–151 g/L |
547 |
63.6 |
|
≥151 g/L |
286 |
33.3 |
|
LDH |
|
|
|
<245 U/L |
50 |
5.81 |
|
≥245 U/L |
810 |
94.2 |
|
T stage |
|
|
|
T1 |
42 |
4.88 |
|
T2 |
165 |
19.2 |
|
T3 |
523 |
60.8 |
|
T4 |
130 |
15.1 |
|
N stage |
|
|
|
N0 |
81 |
9.42 |
|
N1 |
464 |
54.0 |
|
N2 |
271 |
31.5 |
|
N3 |
44 |
5.12 |
|
BMI |
|
|
|
<24 kg/m2 |
518 |
60.2 |
|
24–27.9 kg/m2 |
294 |
34.2 |
|
≥28 kg/m2 |
48 |
5.58 |
|
EBV-DNA |
|
|
|
<4000 copy/mL |
580 |
67.4 |
|
≥4000 copy/mL |
280 |
32.6 |
|
ALB |
|
|
|
≥40 g/L |
788 |
91.6 |
|
<40 g/L |
72 |
8.37 |
|
MAR |
|
|
|
>11.63 |
232 |
27.0 |
|
≤11.63 |
628 |
73.0 |
ALB: albumin; BMI: body mass index; EBV-DNA: Epstein-Barr virus DNA; HGB: haemoglobin; LDH: lactate dehydrogenase; MAR: monocyte-to-albumin ratio; WHO: World Health Organization
Survival data and overall survival (OS) across different MAR groups
The median OS observed in the study population was 123.2 months (interquartile range: 87.8–136.1 months). A total of 174 events were recorded throughout the study duration. The OS rates at 1, 3, 5, and 10 years were recorded at 98.1%, 93.6%, 88.6%, and 80.3%, respectively. Analysis using the Kaplan-Meier method indicated that patients in the low MAR group had a significantly higher survival rate compared to those in the high MAR group (Fig. 1; hazard ratio 0.56; 95% confidence interval [CI] 0.41–0.77, P<0.001)
Fig. 1. Survival curves obtained with Kaplan-Meier analysis between different MAR groups (the hazard ratio reported was unadjusted).
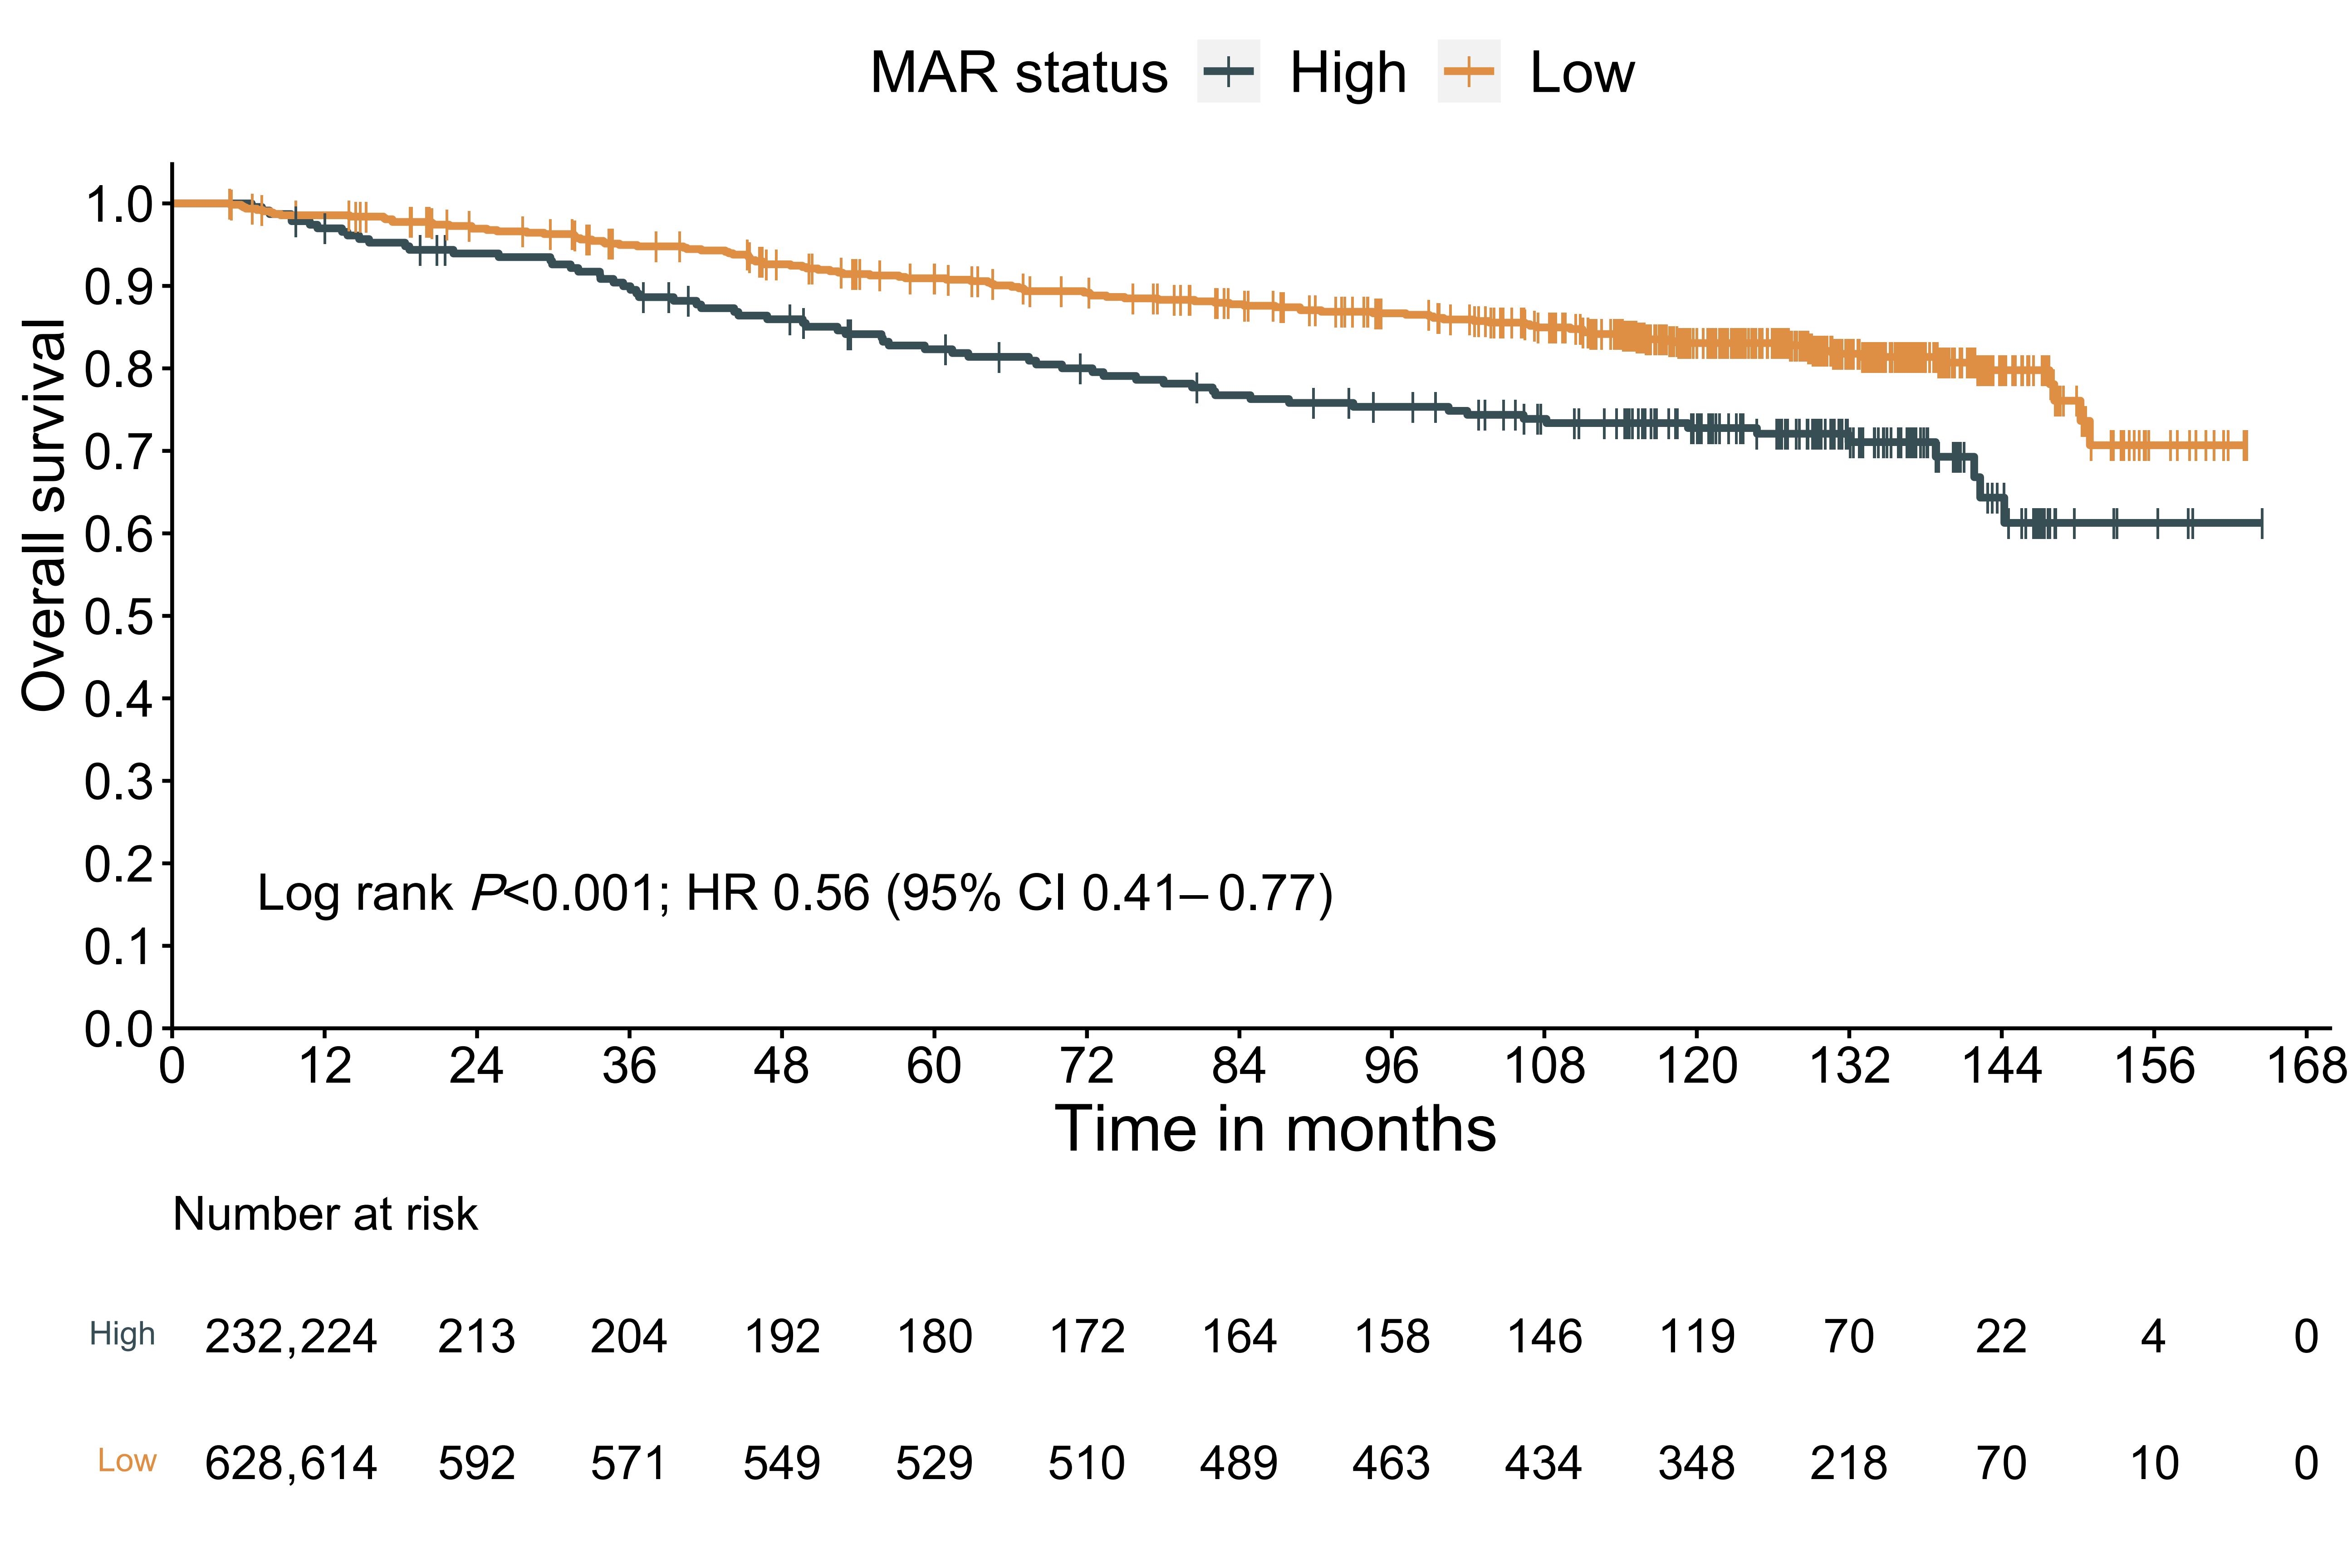 CI: confidence interval; HR: hazard ratio; MAR: monocyte-to-albumin ratio
Univariate and multivariate analyses
Univariate analyses revealed that T stage, N stage, EBV-DNA status, MAR value, BMI category, and age were statistically significant predictors of OS (P<0.10). These variables were incorporated into the multivariate Cox model. The variance inflation factor was calculated for the selected variables, all of which were less than 10. A multicollinearity diagnostic confirmed that severe multicollinearity was absent. Fig. S2 illustrates the diagnostic diagram for assessing proportional hazards, indicating that the multivariate model adheres to the proportional hazards assumption. The multivariate analysis identified T stage, age, N stage, BMI category, and MAR value as independent prognostic factors for OS in NPC patients treated with CCRT (Table 2).
Table 2. Univariate and multivariate Cox regression analyses of OS.
|
Characteristic |
Univariate analysis |
|
Multivariate analysis |
|
|
|
|
HR (95% CI) |
P |
HR (95% CI) |
P |
|
|
Age |
|
|
|
|
|
|
≥45 years |
1 |
|
1 |
|
|
|
<45 years |
0.57 (0.42–0.77) |
<0.001 |
0.54 (0.40–0.74) |
<0.001 |
|
|
Sex |
|
|
|
|
|
|
Female |
1 |
|
|
|
|
|
Male |
1.14 (0.81–1.62) |
0.455 |
|
|
|
|
Histological type |
|
|
|
|
|
|
WHO Ⅰ/Ⅱ |
1 |
|
|
|
|
|
WHO Ⅲ |
0.45 (0.18–1.09) |
0.0778 |
|
|
|
|
HGB |
|
|
|
|
|
|
<113 g/L |
1 |
|
|
|
|
|
113–151 g/L |
1.43 (0.53–3.87) |
0.485 |
|
|
|
|
≥151 g/L |
1.40 (0.51–3.86) |
0.517 |
|
|
|
|
LDH |
|
|
|
|
|
|
≥245 U/L |
1 |
|
|
|
|
|
<245 U/L |
0.61 (0.35–1.05) |
0.0758 |
|
|
|
|
T stage |
|
|
|
|
|
|
T1 |
1 |
|
1 |
|
|
|
T2 |
4.12 (0.98–17.26) |
0.053 |
3.77 (0.90–15.83) |
0.070 |
|
|
T3 |
4.50 (1.11–18.26) |
0.035 |
4.22 (1.04–17.15) |
0.044 |
|
|
T4 |
9.21 (2.23–37.99) |
0.002 |
8.36 (2.02–34.66) |
0.003 |
|
|
N stage |
|
|
|
|
|
|
N0 |
1 |
|
1 |
|
|
|
N1 |
2.77 (1.21–6.33) |
0.016 |
2.93 (1.28–6.73) |
0.011 |
|
|
N2 |
3.60 (1.56–8.32) |
0.003 |
3.90 (1.68–9.10) |
0.002 |
|
|
N3 |
5.01 (1.90–13.20) |
0.001 |
4.98 (1.86–13.34) |
0.001 |
|
|
BMI |
|
|
|
|
|
|
<24 kg/m2 |
1 |
|
1 |
|
|
|
24–27.9 kg/m2 |
0.71 (0.51–0.99) |
0.046 |
0.93 (0.47–1.84) |
0.826 |
|
|
≥28 kg/m2 |
0.82 (0.41–1.61) |
0.554 |
0.69 (0.49–0.97) |
0.035 |
|
|
EBV-DNA |
|
|
|
|
|
|
<4000 copy/mL |
1 |
|
1 |
|
|
|
≥4000 copy/mL |
1.62 (1.20–2.20) |
0.002 |
1.34 (0.98–1.83) |
0.071 |
|
|
MAR |
|
|
|
|
|
|
>11.63 |
1 |
|
1 |
|
|
|
≤11.63 |
0.56 (0.41–0.77) |
<0.001 |
0.64 (0.47–0.87) |
0.004 |
|
HRs estimated by Cox proportional hazards regression. All statistical tests were 2-sided.
ALB: albumin; BMI: body mass index; EBV-DNA: Epstein-Barr virus DNA; HGB: haemoglobin; HR: hazard ratio; LDH: lactate dehydrogenase; MAR: monocyte-to-albumin ratio; OS: overall survival; WHO: World Health Organization
Establishing a new prognostic model grounded in MAR
Drawing from the 5 independent prognostic variables identified in the multivariate analysis, a new nomogram prognostic model was established to estimate patient survival probabilities (Fig. 2). For example, a 56-year-old patient classified as T2 N3 with a BMI of 25 and a MAR score exceeding 11.63 had a total score of 18.75 (2.75 + 6 + 7.94 + 0 + 2.06), with corresponding 1-, 3-, 5-, and 10-year OS rates of 96.86%, 88.32%, 79.20%, and 64.96%, respectively.
Fig. 2. Nomogram of the current prognostic model for individualised survival predictions.
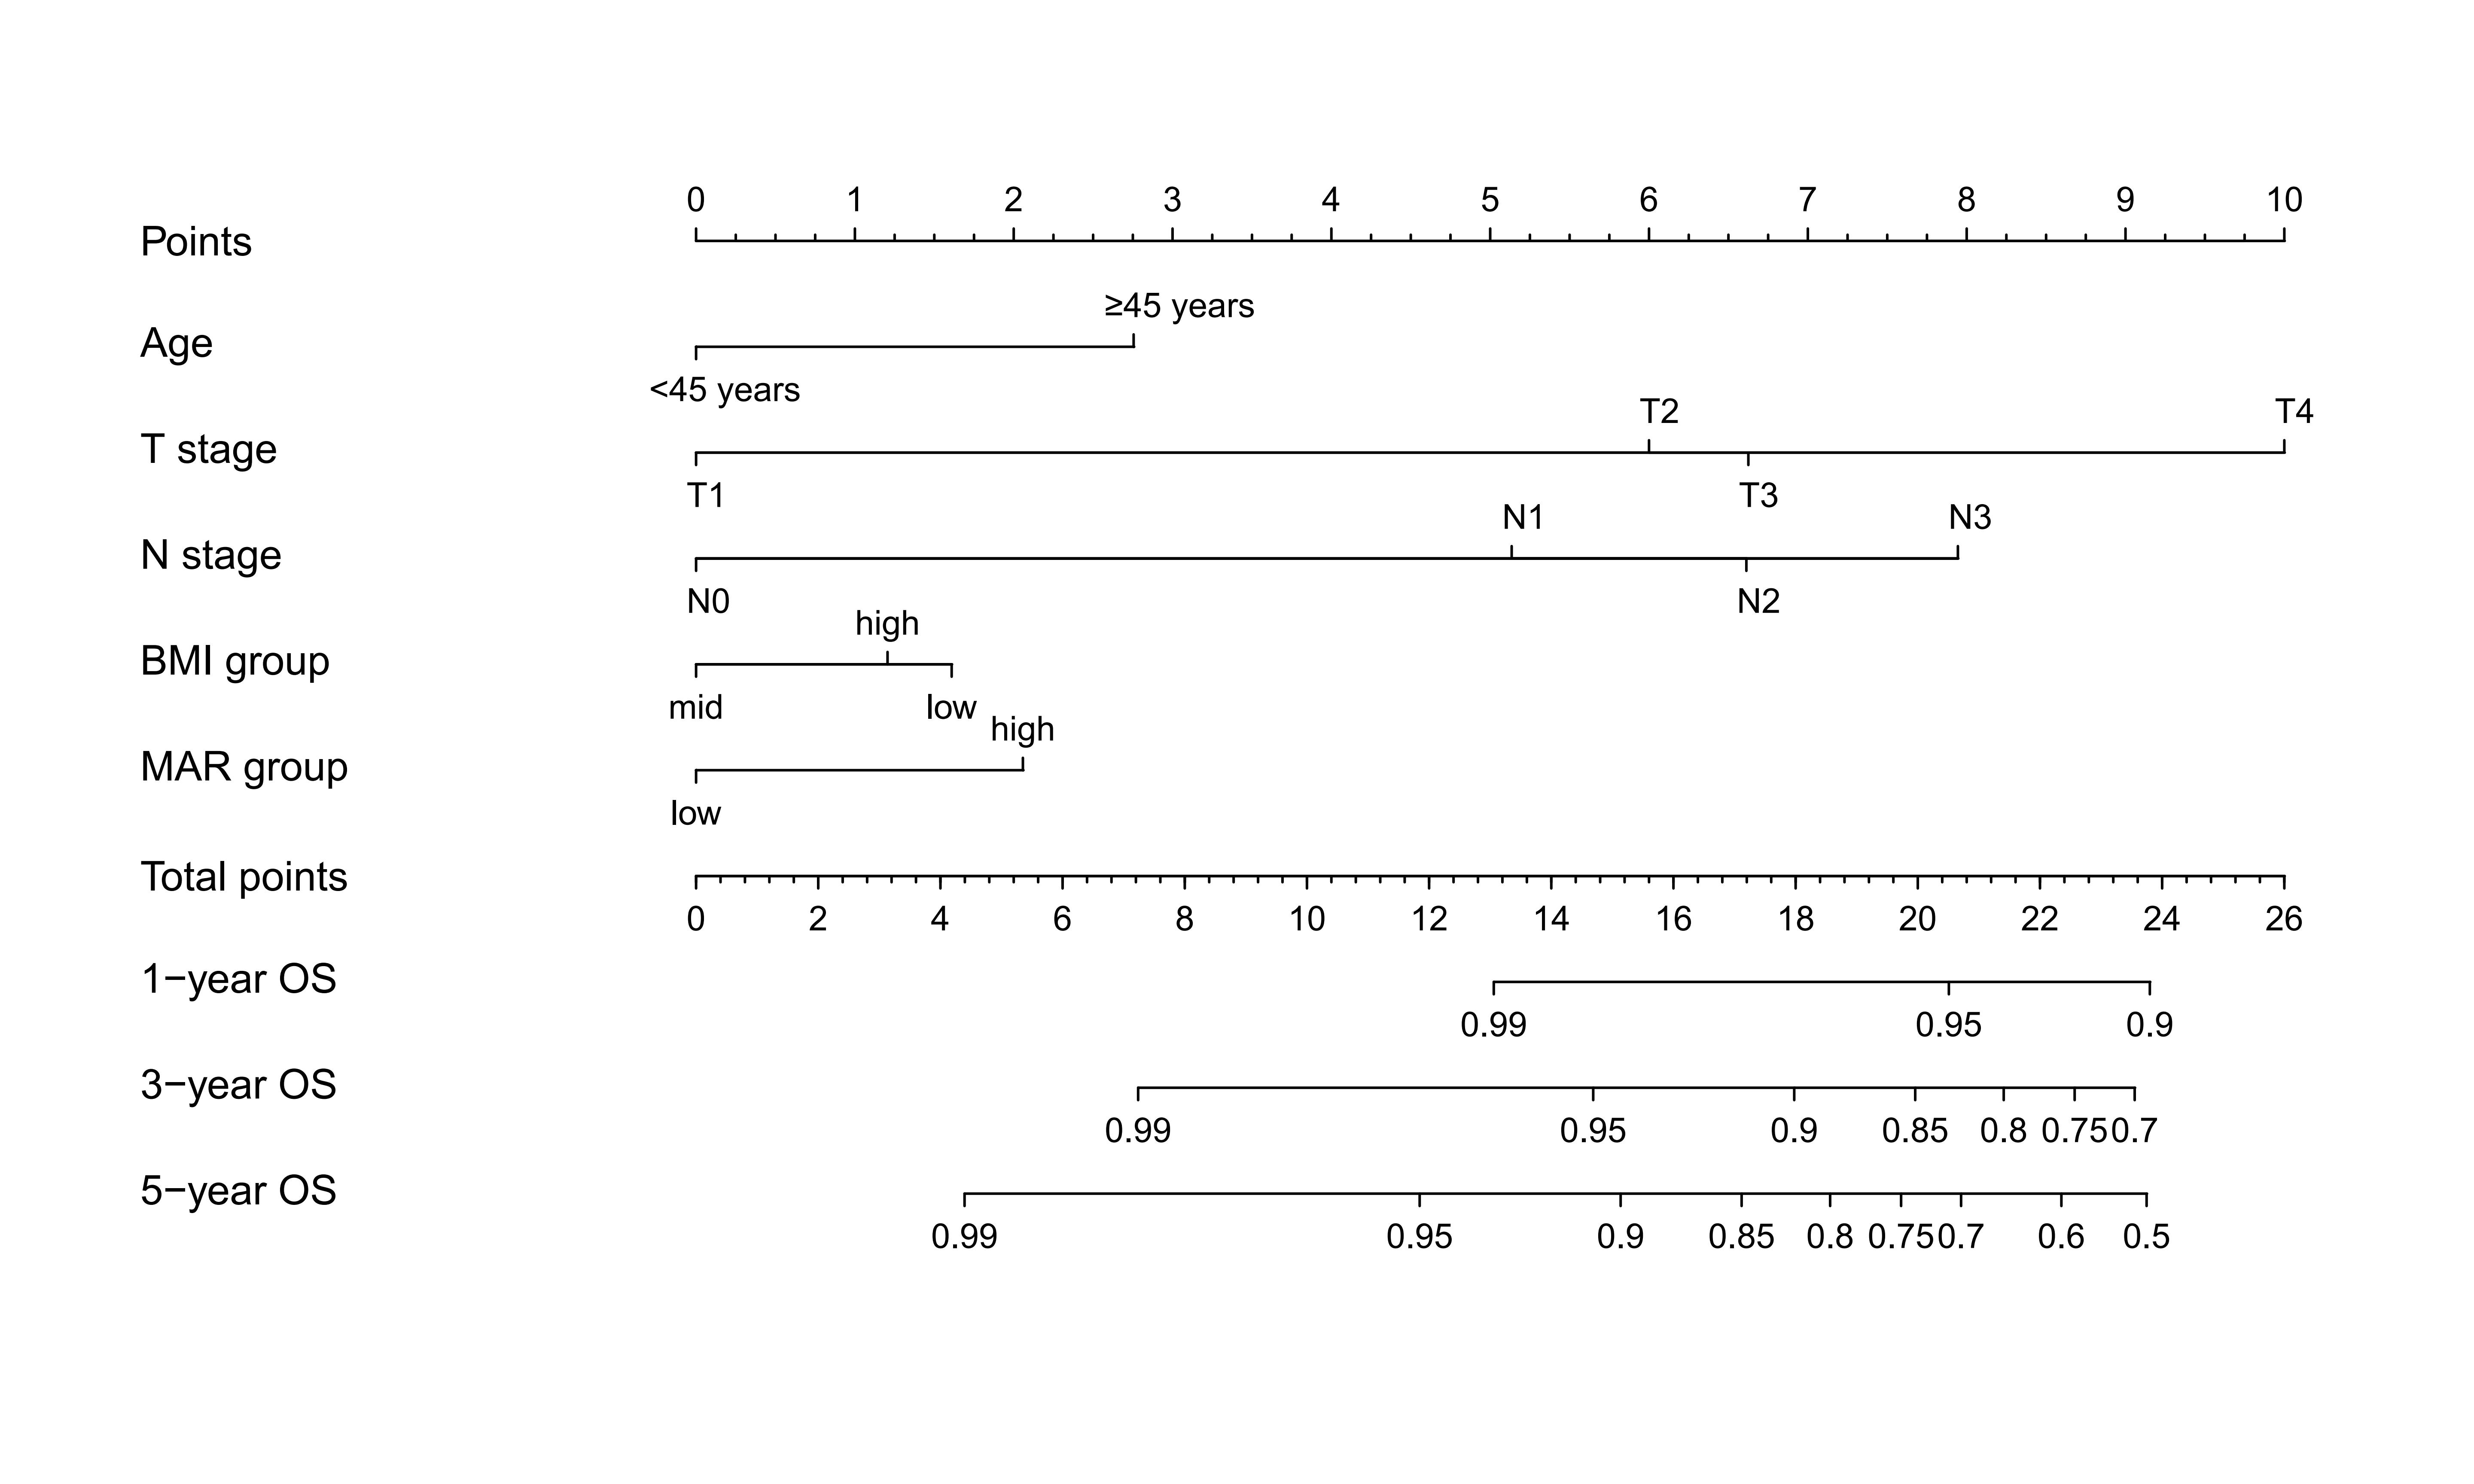 BMI: body mass index; MAR: monocyte-to-albumin ratio; OS: overall survival
Assessment of the predictive performance of the new prognostic model
The C-index for OS determined for the nomogram was 0.68 (95% CI 0.64–0.72), outperforming the C-index of the traditional TNM staging system, which was 0.64 (95% CI 0.57–0.70), thereby demonstrating satisfactory discriminatory power. Calibration plots for OS (Fig. 3A) depicted the concordance between predicted and actual survival frequencies. Fig. 3B presents the time-dependent ROC curve, illustrating the prognostic accuracy of the newly formulated prediction model, which surpassed that of the conventional TNM staging system. Fig. 3C illustrates the decision curve analysis curves that compare the net advantages of the current prediction model against that of the traditional TNM staging approach. This nomogram evidenced superior predictive accuracy relative to the standard TNM staging system.
Fig. 3. Assessment of predictive performance of the prognostic model. (A) Calibration plot of the nomogram model at 1, 3, 5, and 10 years. (B) Time-dependent ROC curves compared the predictive accuracy of the current model and the traditional TNM stage. (C) DCA curves compared the net benefit rate of the current model and the traditional TNM stage.
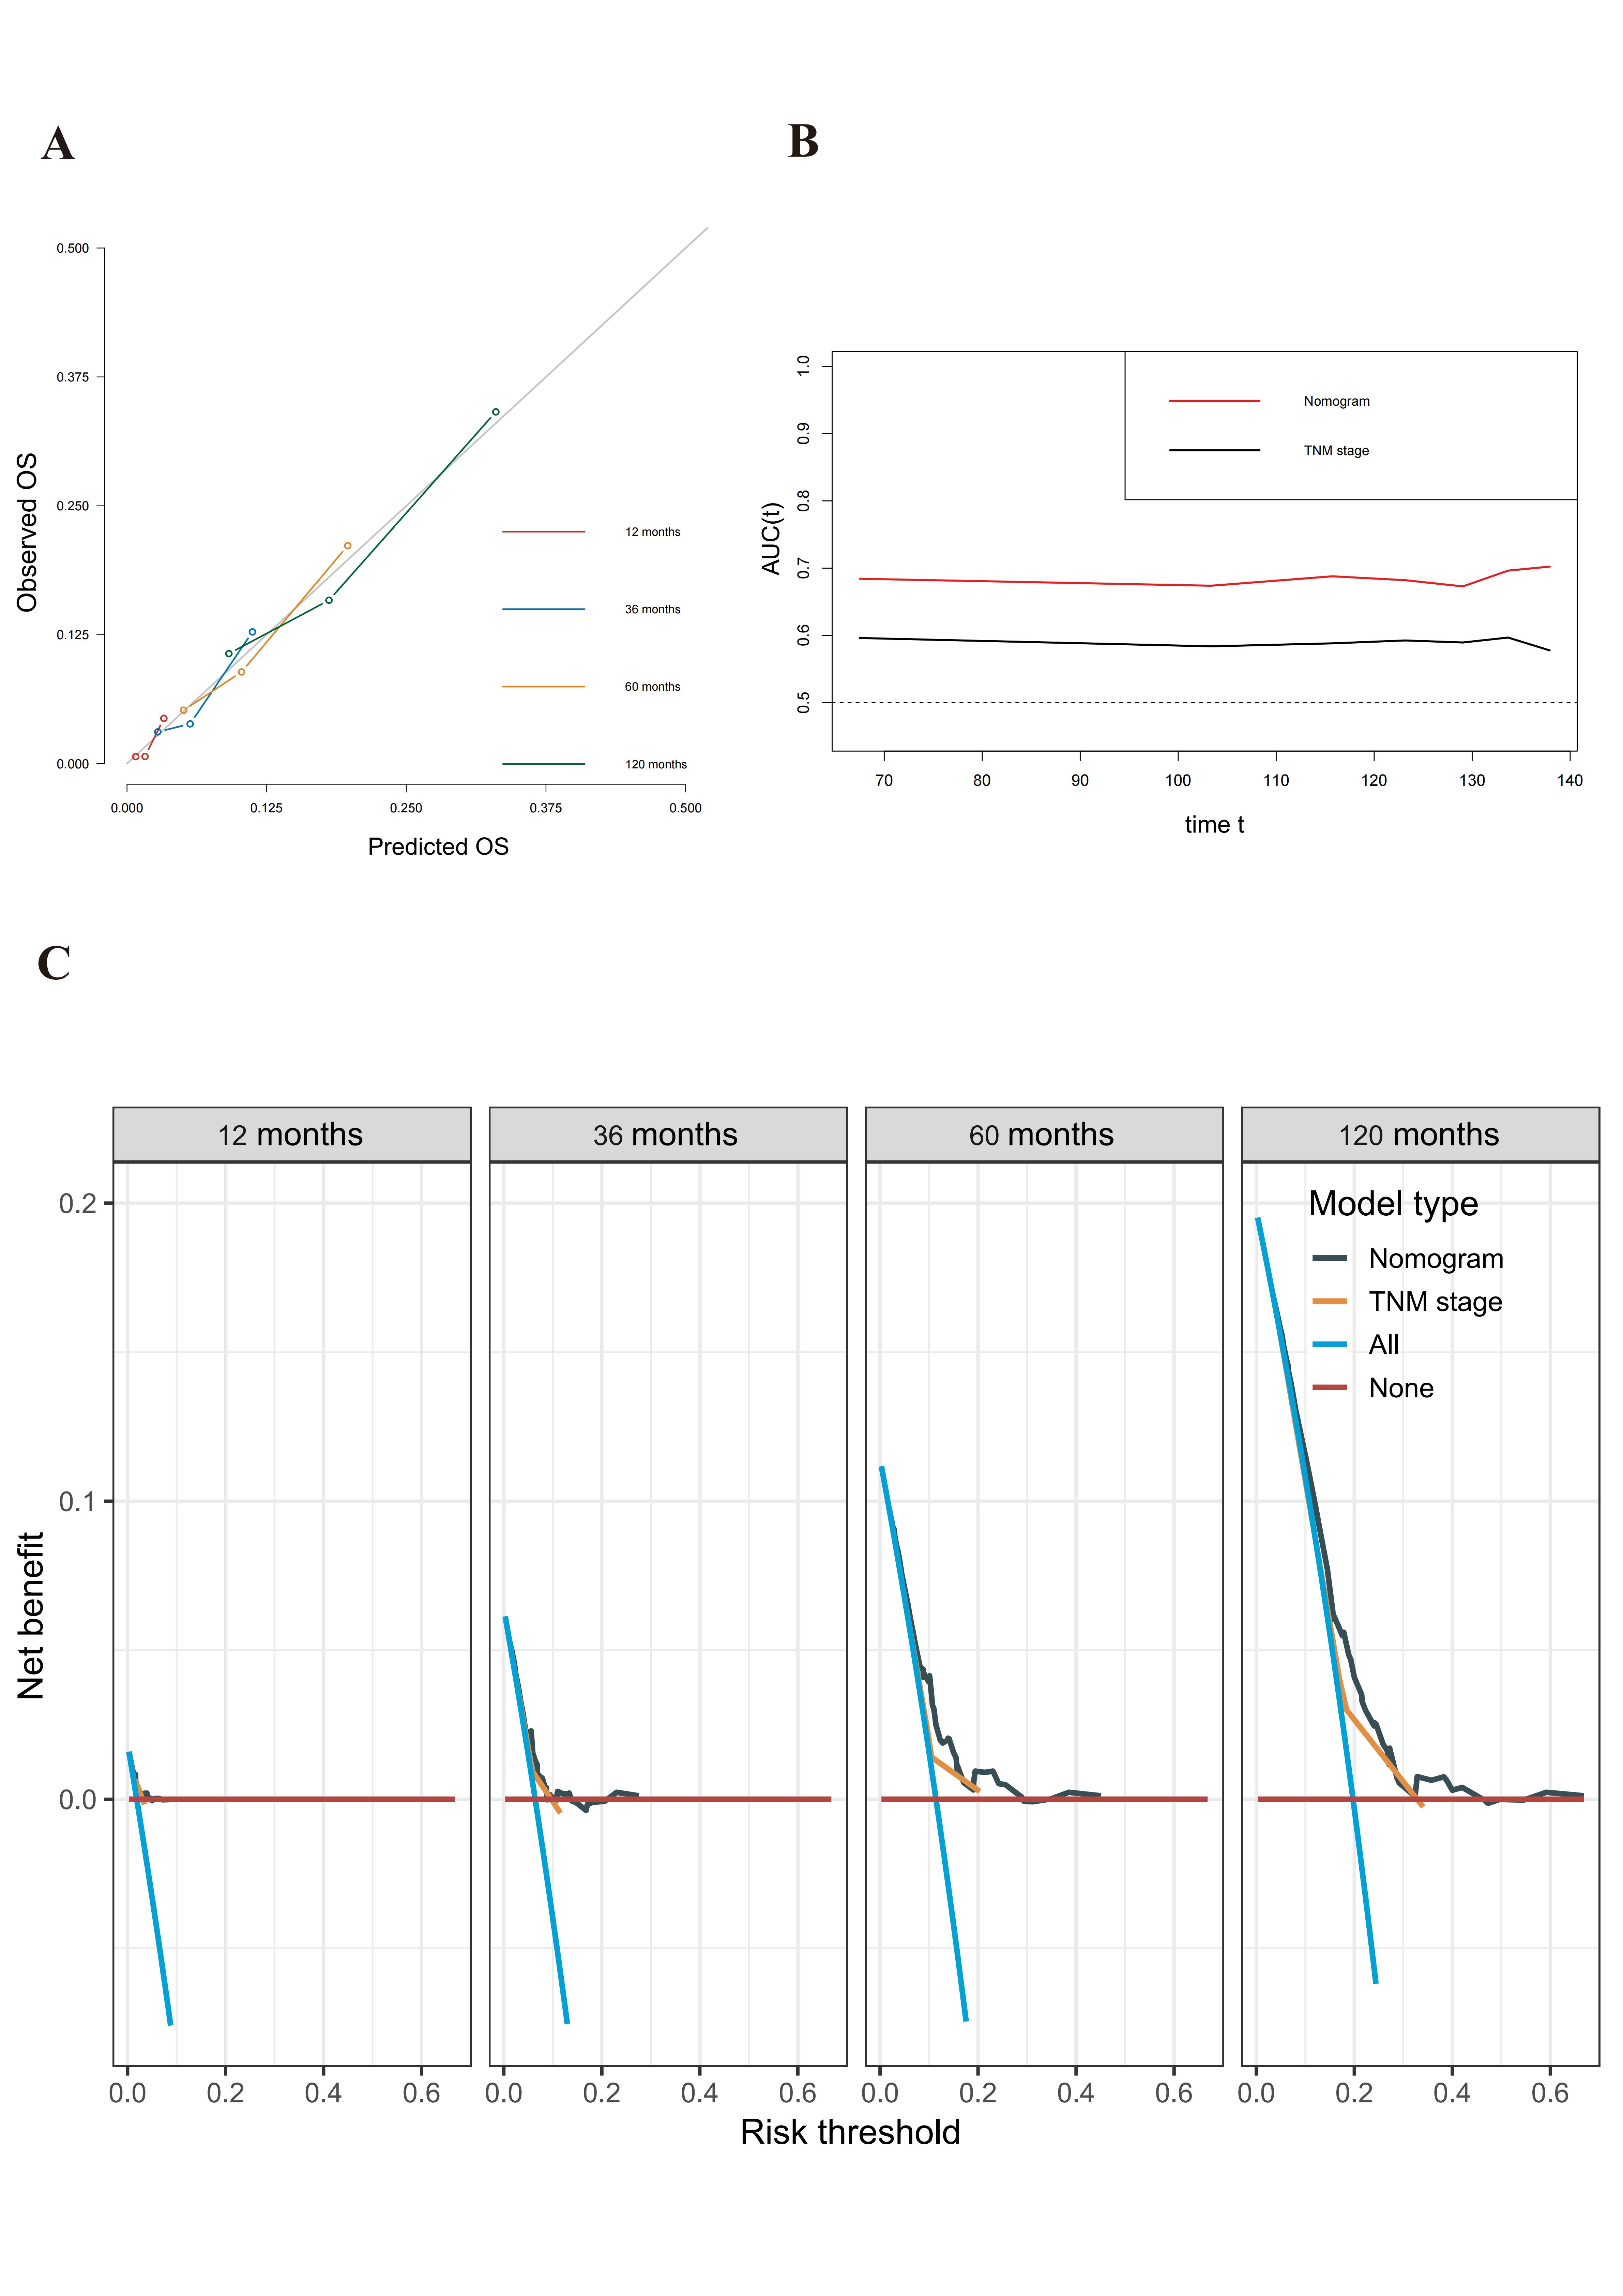 AUC: area under the curve; DCA: decision curve analysis; OS: overall survival; ROC: receiver operating characteristic; TNM: tumour–node–metastasis
DISCUSSION
To the best of the authors’ knowledge, this study is the first to examine MAR’s predictive value for OS in NPC patients undergoing CCRT. The results indicate that patients with pre-treatment MAR levels below 11.63 enjoy significantly improved OS compared to those with levels at or above 11.63. Furthermore, multivariate analysis confirmed MAR as an independent prognostic indicator. The authors developed a user-friendly nomogram based on MAR for practical clinical application.
The conventional TNM staging system primarily categorises disease stages according to the anatomical extent of tumour invasion, directing further treatment strategies. However, this framework lacks sufficient predictive accuracy and personalisation for NPC patients receiving CCRT. This study successfully integrates the novel nutritional-inflammatory marker MAR into a prognostic framework, promoting individualised prognostic evaluations among diverse patient populations. This model provides clinicians with a timely and cost-efficient biomarker to support clinical decision-making.
Variability in prognosis among patients with identical TNM stages further emphasises the need for biological insights that transcend anatomical descriptions. Prior research suggests that including nutritional and inflammatory indicators can enhance clinical prognosis precision. Elevated monocyte counts have been linked to substantial tumour burden, potentially leading to poorer outcomes in specific solid tumours.20-22 Additionally, albumin levels represent malnutrition and inflammatory states, frequently correlating with adverse prognoses and increased mortality rates in cancer patients.23,24 The MAR index—a ratio of monocyte counts to albumin concentrations—effectively reflects systemic inflammation and nutritional status. This retrospective analysis illustrates a significant association between pre-treatment MAR scores and OS in 860 NPC patients receiving CCRT, with scores below 11.63 correlating with improved OS (HR 0.56, 95% CI 0.41–0.77, P<0.001). This highlights MAR’s potential as a biomarker for predicting both clinical prognosis and treatment outcomes in NPC patients. Furthermore, this predictive nomogram model that integrates MAR with TNM staging outperforms traditional models, enhancing prognosis prediction accuracy.
It is important to recognise that the systemic inflammatory response is critical in tumour development and the treatment process, serving as a determinant of survival rates across various cancer types.25 Inflammatory cells engage with tumour cells to facilitate angiogenesis, remodel the extracellular matrix, and sustain an inflammatory microenvironment conducive to metastasis.26 Monocytes are pivotal to innate immunity, migrating into tumour tissues and differentiating into TAMs when influenced by inflammatory conditions, thus promoting tumour progression.8 This interaction illustrates the dual impact of both inflammation and nutritional status on tumour dynamics, as increased tumour load often results in hypoproteinaemia due to nutritional inadequacies amid heightened inflammatory responses.27-33 Therefore, recent studies also highlight that combining these inflammatory and nutritional markers can effectively predict patient survival in NPC.34-37
The findings corroborate previous studies that identified age, N stage, T stage, and BMI score as independent prognostic factors for OS in NPC patients undergoing CCRT.38 The nomogram developed in this study acts as a roadmap for tailored treatment planning, allowing clinicians to intensify treatment interventions (e.g. neoadjuvant or adjuvant chemotherapy) for higher-scoring patients while simultaneously addressing their nutritional and inflammatory support needs.
Limitations
The MAR metric is dynamic, subject to fluctuations influenced by various factors, which can impact the stability of consequent analyses. Additionally, the predictive model was generated from data sourced from a single centre, necessitating validation through high-quality datasets from multiple institutions. Furthermore, retrospective study designs are often vulnerable to selection bias, which may influence the accuracy of the results. Moreover, since this study relied entirely on retrospective blood tests, there was a lack of corresponding tissue slides to visually confirm monocyte infiltration. Future research will prioritise prospective multicentre studies incorporating pathological imaging to address these limitations and enhance the accuracy and overall applicability of the predictive model.
CONCLUSION
In conclusion, the findings highlight MAR as a novel nutritional-inflammatory biomarker that can serve as a significant predictor of survival rates in NPC patients undergoing CCRT. The prognostic capabilities of the MAR score nomogram exceed those of traditional staging methods, demonstrating its potential to refine prognostic tools. This newly developed predictive nomogram represents a reliable, efficient, straightforward, affordable, and non-invasive means for stratifying patients based on their responses to CCRT.
Supplementary materials
Fig. S1. Cut-off value of MAR.
Fig. S2. Proportional hazards diagnostic plot.
REFERENCES
- Chen YP, Chan ATC, Le QT, et al. Nasopharyngeal carcinoma. Lancet 2019;394:64-80.
- Mao YP, Xie FY, Liu LZ, et al. Re-evaluation of 6th edition of AJCC staging system for nasopharyngeal carcinoma and proposed improvement based on magnetic resonance imaging. Int J Radiat Oncol Biol Phys 2009;73:1326-34.
- Langendijk JA, Leemans CR, Buter J, et al. The additional value of chemotherapy to radiotherapy in locally advanced nasopharyngeal carcinoma: a meta-analysis of the published literature. J Clin Oncol 2004;22:4604-12.
- Hui EP, Li WF, Ma BB, et al. Integrating postradiotherapy plasma Epstein-Barr virus DNA and TNM stage for risk stratification of nasopharyngeal carcinoma to adjuvant therapy. Ann Oncol 2020;31:769-79.
- Zhang L, Huang Y, Hong S, et al. Gemcitabine plus cisplatin versus fluorouracil plus cisplatin in recurrent or metastatic nasopharyngeal carcinoma: a multicentre, randomised, open-label, phase 3 trial. Lancet 2016;388:1883-92.
- Zitvogel L, Pietrocola F, Kroemer G. Nutrition, inflammation and cancer. Nat Immunol 2017;18:843-50.
- Hanahan D, Weinberg RA. Hallmarks of cancer: the next generation. Cell 2011;144:646-74.
- Chen Y, Song Y, Du W, et al. Tumor-associated macrophages: an accomplice in solid tumor progression. J Biomed Sci 2019;26:78.
- Lu H, Guo S, Liu L, et al. Prognostic significance of a combined and controlled nutritional status score and EBV-DNA in patients with advanced nasopharyngeal carcinoma: a long-term follow-up study. Cancer Biol Med 2021;19:551-64.
- Chua MLK, Tan SH, Kusumawidjaja G, et al. Neutrophil-to-lymphocyte ratio as a prognostic marker in locally advanced nasopharyngeal carcinoma: A pooled analysis of two randomised controlled trials. Eur J Cancer 2016;67:119-29.
- Tu X, Ren J, Zhao Y. Prognostic value of prognostic nutritional index in nasopharyngeal carcinoma: A meta-analysis containing 4511 patients. Oral Oncol 2020;110:104991.
- Xu SS, Li S, Xu HX, et al. Haemoglobin, albumin, lymphocyte and platelet predicts postoperative survival in pancreatic cancer. World J Gastroenterol 2020;26:828-38.
- Zhao ST, Chen XX, Yang XM, et al. Application of Monocyte-to-Albumin Ratio and Neutrophil Percentage-to-Hemoglobin Ratio on Distinguishing Non-Small Cell Lung Cancer Patients from Healthy Subjects. Int J Gen Med 2023;16:2175-85.
- Chen X, Li Y, Xia H, et al. Monocytes in Tumorigenesis and Tumor Immunotherapy. Cells 2023;12:1673.
- Wang S, Wang J, Chen Z, et al. Targeting M2-like tumor-associated macrophages is a potential therapeutic approach to overcome antitumor drug resistance. NPJ Precis Oncol 2024;8:31.
- Yuan M, Mao WE, He X, et al. Novel Marker for Predicting Prognosis in Hepatitis B Virus-Associated Decompensated Cirrhosis: Monocyte-To-Albumin Ratio. Clin Lab 2023;69.
- Zhang ZL, Guo QQ, Tang JN, et al. Monocyte-to-albumin ratio as a novel predictor of long-term adverse outcomes in patients after percutaneous coronary intervention. Biosci Rep 2021;41:BSR20210154.
- Riley RD, Ensor J, Snell KIE, et al. Calculating the sample size required for developing a clinical prediction model. BMJ 2020;368:m441.
- Hua X, Duan F, Zhai W, et al. A Novel Inflammatory-Nutritional Prognostic Scoring System for Patients with Early-Stage Breast Cancer. J Inflamm Res 2022;15:381-94.
- Shibutani M, Maeda K, Nagahara H, et al. Prognostic significance of the lymphocyte-to-monocyte ratio in patients with metastatic colorectal cancer. World J Gastroenterol 2015;21:9966-73.
- Yin W, Lv J, Yao Y, et al. Elevations of monocyte and neutrophils, and higher levels of granulocyte colony-stimulating factor in peripheral blood in lung cancer patients. Thorac Cancer 2021;12:2680-90.
- Kumagai S, Marumo S, Shoji T, et al. Prognostic impact of preoperative monocyte counts in patients with resected lung adenocarcinoma. Lung Cancer 2014;85:457-64.
- Zhang J, Li SQ, Liao ZH, et al. Prognostic value of a novel FPR biomarker in patients with surgical stage II and III gastric cancer. Oncotarget 2017;8:75195-205.
- Kotoh Y, Saeki I, Yamasaki T, et al. Albumin-bilirubin score as a useful predictor of energy malnutrition in patients with hepatocellular carcinoma. Clin Nutr 2021;40:3585-91.
- Hussain SP, Harris CC. Inflammation and cancer: an ancient link with novel potentials. Int J Cancer 2007;121:2373-80.
- Philip M, Rowley DA, Schreiber H. Inflammation as a tumor promoter in cancer induction. Semin Cancer Biol 2004;14:433-9.
- Higginson AD, McNamara JM, Houston AI. The starvation-predation trade-off shapes the strategic use of protein for energy during fasting. J Theor Biol 2014;359:208-19.
- Argilés JM, Busquets S, Stemmler B, et al. Cancer cachexia: understanding the molecular basis. Nat Rev Cancer 2014;14:754-62.
- Falconer JS, Fearon KC, Plester CE, et al. Cytokines, the acute-phase response, and resting energy expenditure in cachectic patients with pancreatic cancer. Ann Surg 1994;219:325-31.
- Levitt DG, Levitt MD. Human serum albumin homeostasis: a new look at the roles of synthesis, catabolism, renal and gastrointestinal excretion, and the clinical value of serum albumin measurements. Int J Gen Med 2016;9:229-55.
- Fleck A, Raines G, Hawker F, et al. Increased vascular permeability: a major cause of hypoalbuminaemia in disease and injury. Lancet 1985;1:781-4.
- Franch-Arcas G. The meaning of hypoalbuminaemia in clinical practice. Clin Nutr 2001;20:265-9.
- Gobbi PG, Gendarini A, Crema A, et al. Serum albumin in Hodgkin’s disease. Cancer 1985;55:389-93.
- Fang WN, Wu HX, Wu ZP, et al. A scoring system based on inflammatory and nutritional indicators to predict the long-term survival of patients with non-metastatic nasopharyngeal carcinoma. Sci Rep 2024;14:20229.
- Aydin AA, Yuceer RO, Yildirim S, et al. The Prognostic Significance of CD47, CD68, and CD163 Expression Levels and Their Relationship with MLR and MAR in Locally Advanced and Oligometastatic Nasopharyngeal Carcinoma. Diagnostics (Basel) 2024;14:2648.
- Cheng G, Yuan S, Wang J, et al. A prognostic nomogram for patients with III-IV nasopharyngeal carcinoma based on dynamic changes in the inflammatory and nutrition index. Clin Transl Oncol 2025;27:2638-50.
- Tang M, Zhan Y, Wei S, et al. A prognostic nomogram integrating Epstein-Barr virus DNA and specific inflammatory indices for early recurrent or metastatic nasopharyngeal carcinoma after first-line nedaplatin-based therapy. Discov Oncol 2026;17:310.
- Jin X, Hu R, Guo H, et al. Pretreatment Body Mass Index (BMI) as an Independent Prognostic Factor in Nasopharyngeal Carcinoma Survival: A Systematic Review and Meta-Analysis. Nutr Cancer 2022;74:3457-67.
Approval was obtained from the Sun Yat-sen University Cancer Center’s Ethics Committee (SL-B2023-537-01), which waived the requirement for written informed consent. All procedures were conducted in accordance with the principles of the 1964 Helsinki Declaration and its amendments.
The authors declare they have no affiliations with or involvement in any organisation or entity with any financial interest in the subject matter or materials discussed in this manuscript. There is no conflict of interest or funding to declare. The authors also confirm that no generative artificial intelligence (AI) or AI-assisted technologies were used in the preparation or writing of this manuscript.
Dr Xin Hua, Department of Radiation Oncology, Guangdong Provincial People’s Hospital (Guangdong Academy of Medical Sciences), Southern Medical University, No. 106, Zhongshan Er Road, Yuexiu District, Guangzhou 510055, China. Email: [email protected]; Dr Sha-Sha Du, Department of Radiation Oncology, Guangdong Provincial People’s Hospital (Guangdong Academy of Medical Sciences), Southern Medical University, No. 106, Zhongshan Er Road, Yuexiu District, Guangzhou 510055, China. Email: [email protected]; Dr Ao-Qiang Chen, Sun Yat-sen University Cancer Center, State Key Laboratory of Oncology in South China, Guangdong Provincial Clinical Research Center for Cancer, Guangdong Key Laboratory of Nasopharyngeal Carcinoma Diagnosis and Therapy, No. 651, Dongfeng East Road, Yuexiu District, Guangzhou 510060, China. Email: [email protected]
